
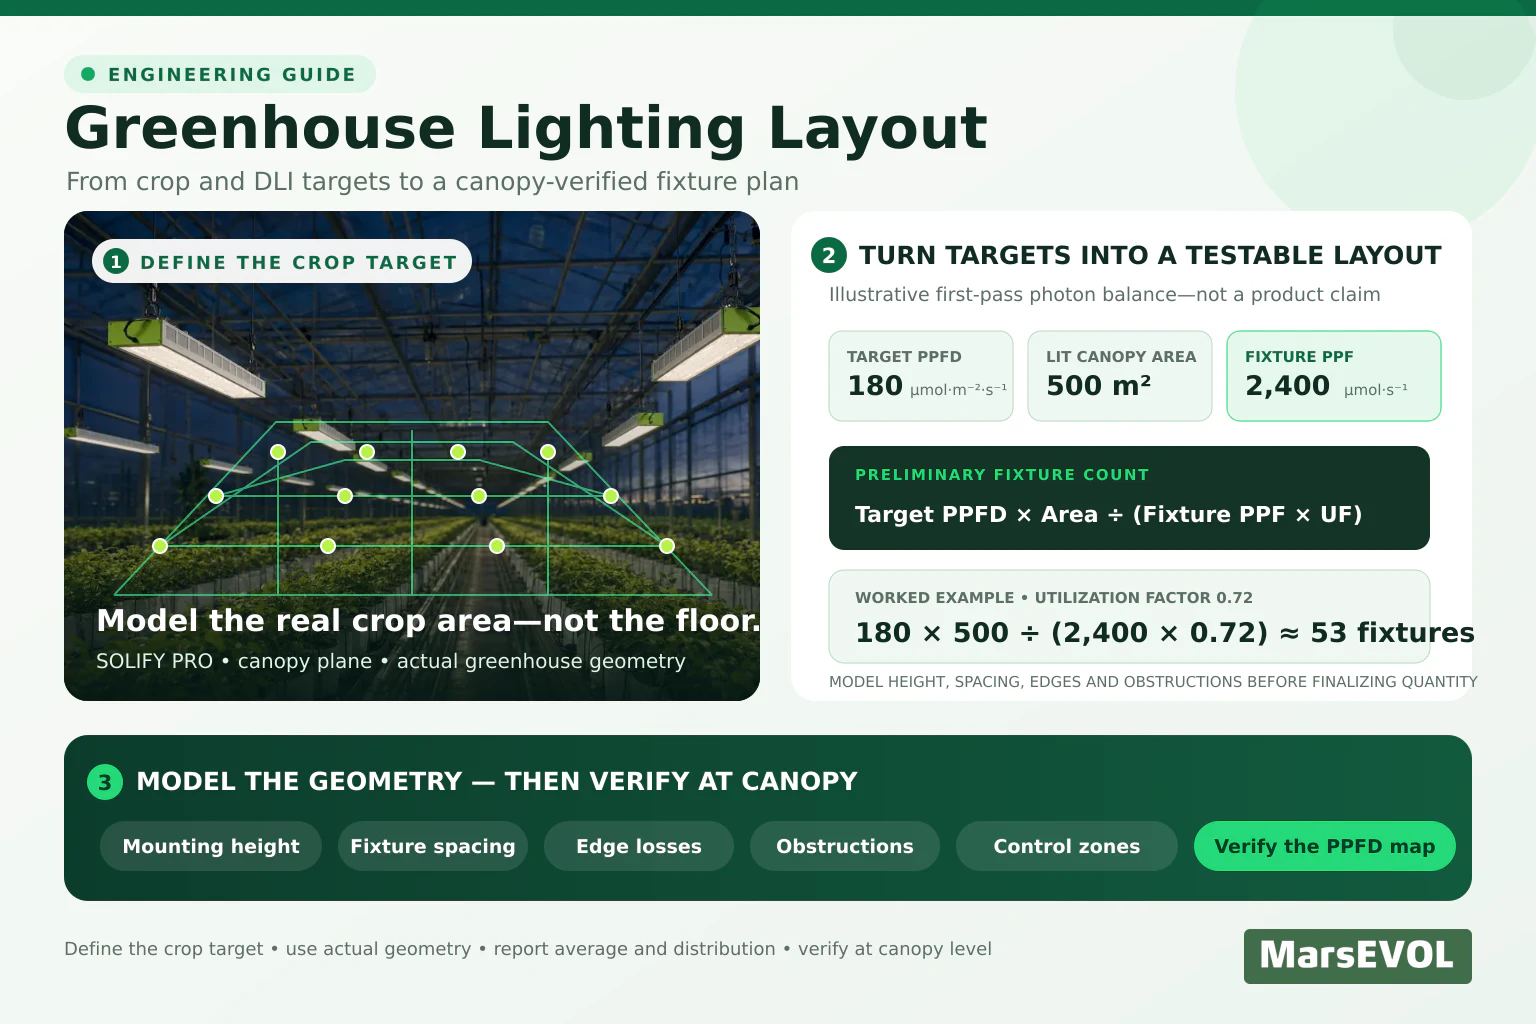
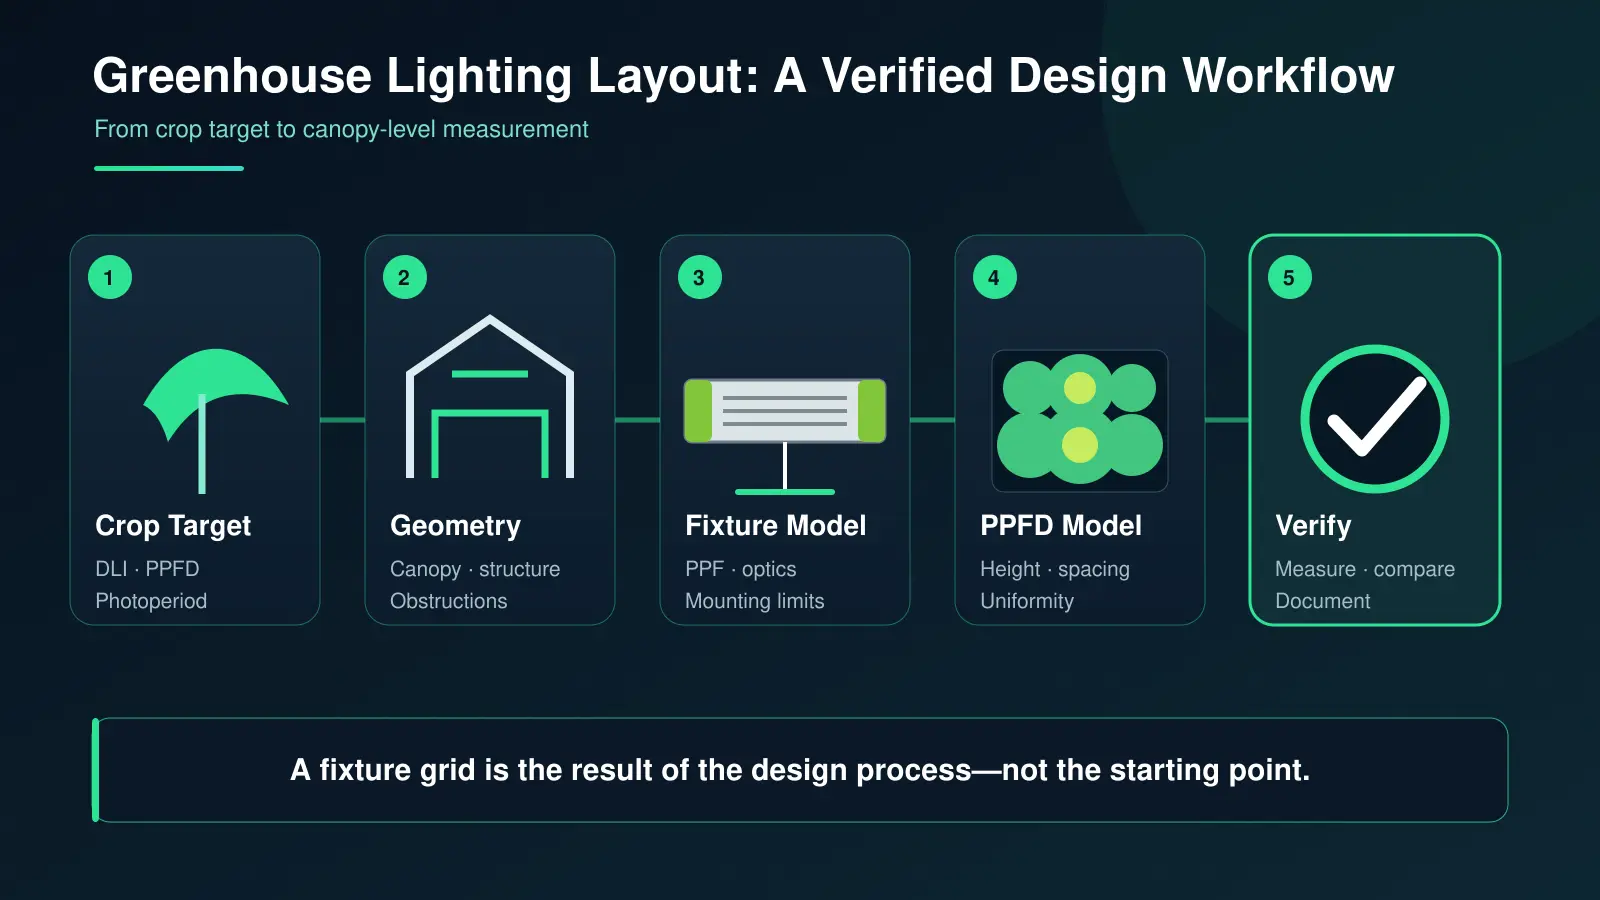
A professional greenhouse lighting layout starts with the required supplemental PPFD at crop-canopy level—not fixture wattage or a fixed spacing rule. Define the crop target and sunlight deficit, document the greenhouse geometry, select a fixture with suitable photon output and light distribution, estimate quantity, then optimize mounting height and spacing through photometric simulation. The final design should be verified with a canopy-level PPFD map before it is accepted.
Key Takeaways
- Start with crop target DLI and the supplemental PPFD requirement; do not start with a fixture count.
- Mounting height, spacing, optics, greenhouse structure, and edge losses must be evaluated together.
- A good average PPFD can hide dark zones. Always report light uniformity and the full measurement grid.
- Fixture-count formulas are useful for a first estimate, but a photometric model is required for the final layout.
- Verify the installed system at the actual crop-canopy height with a calibrated quantum sensor.
How Do You Define the Target Before Drawing a Greenhouse Lighting Layout?
Define the crop, growth stage, production objective, target DLI, expected natural-light contribution, lighting window, and target supplemental PPFD before placing any luminaire. The layout is the final expression of that crop-lighting requirement.
If these values are not yet known, begin with our guides to greenhouse supplemental lighting, calculating crop DLI, and using PPFD and DLI together.
The basic conversion is:
For example, delivering a supplemental DLI of 6 mol·m−2·d−1 over a 10-hour lighting window requires an average electric-light contribution of approximately 167 μmol·m−2·s−1. For variable daily operation, see the detailed supplemental lighting runtime guide.
This target is the average contribution required at the crop canopy. It is not the PPF printed on a fixture datasheet, and it does not yet define fixture quantity.
Which Greenhouse and Crop Inputs Does the Layout Need?
A useful layout model needs the actual lit canopy, canopy-height range, mounting structure, obstructions, row or bench geometry, electrical limits and control zones—not only floor length and width. Record every condition that can change the light reaching the crop.
| Input | Why it matters |
|---|---|
| Lit canopy length, width, and active area | Defines the calculation boundary and separates crop area from aisles |
| Current and mature canopy height | Sets the fixture-to-canopy distance throughout the crop cycle |
| Trusses, gutters, pipes, screens, and equipment | Creates shadows and may restrict mounting positions |
| Bench, bed, or row arrangement | Determines whether a full grid, row-aligned, or zone layout is appropriate |
| Greenhouse covering and transmission | Affects available sunlight and the supplemental-light deficit |
| Electrical circuits and control zones | Constrains fixture grouping, dimming, wiring, and future expansion |
| Climate and irrigation equipment clearances | Prevents conflicts with airflow, service access, booms, and sprinklers |
Covering performance changes with material, age, condensation, dust, screens, and incidence angle. Use the greenhouse covering light-transmission guide when estimating the natural-light component.
How Should Fixtures Be Selected for a Greenhouse Lighting Layout?
Select fixtures by canopy-level photometric performance, optical distribution, controls and project constraints—not by wattage alone. Electrical wattage describes input power; it does not show how many photosynthetic photons reach the canopy. Compare fixtures using plant-lighting quantities and project conditions:
- PPF (μmol·s−1): total photosynthetic photon output from the fixture.
- PPE (μmol·J−1): photon output per joule of electrical energy.
- Light distribution: the intensity pattern that determines coverage, overlap, and edge loss.
- Dimming and controls: compatibility with the intended zones and operating strategy.
- Environmental suitability: ingress protection, ambient-temperature limits, electrical certification, and cleaning requirements.
- Mechanical suitability: fixture size, mass, mounting method, cable routing, and structural loading.
ANSI/ASABE S640 provides standardized terminology for radiation quantities used in plant production, while ANSI/ASABE S644:2025 establishes criteria for designing electromagnetic-radiation systems for plants. Use reported fixture data consistently and avoid mixing lumens or lux with plant-response metrics.
How Do You Estimate the Required Fixture Quantity?
Use a first-pass photon balance to test whether a proposed quantity is plausible, then refine it through project-specific photometric modeling.
The utilization factor represents the fraction of fixture PPF estimated to reach the defined canopy area. It depends on fixture distribution, mounting height, spacing, greenhouse geometry, reflections, obstructions, and boundary losses. It must be supported by photometric modeling; it should not be copied from another project.
First-pass example
- Lit canopy area: 500 m2
- Target supplemental PPFD: 180 μmol·m−2·s−1
- Fixture PPF: 2,400 μmol·s−1
- Preliminary utilization assumption: 0.72
The initial model would therefore test about 53 fixtures. This is not a final bill of materials. The quantity may change after edge compensation, shadow analysis, mounting constraints, zoning, and uniformity optimization.
How Should Mounting Height and Fixture Spacing Be Optimized?
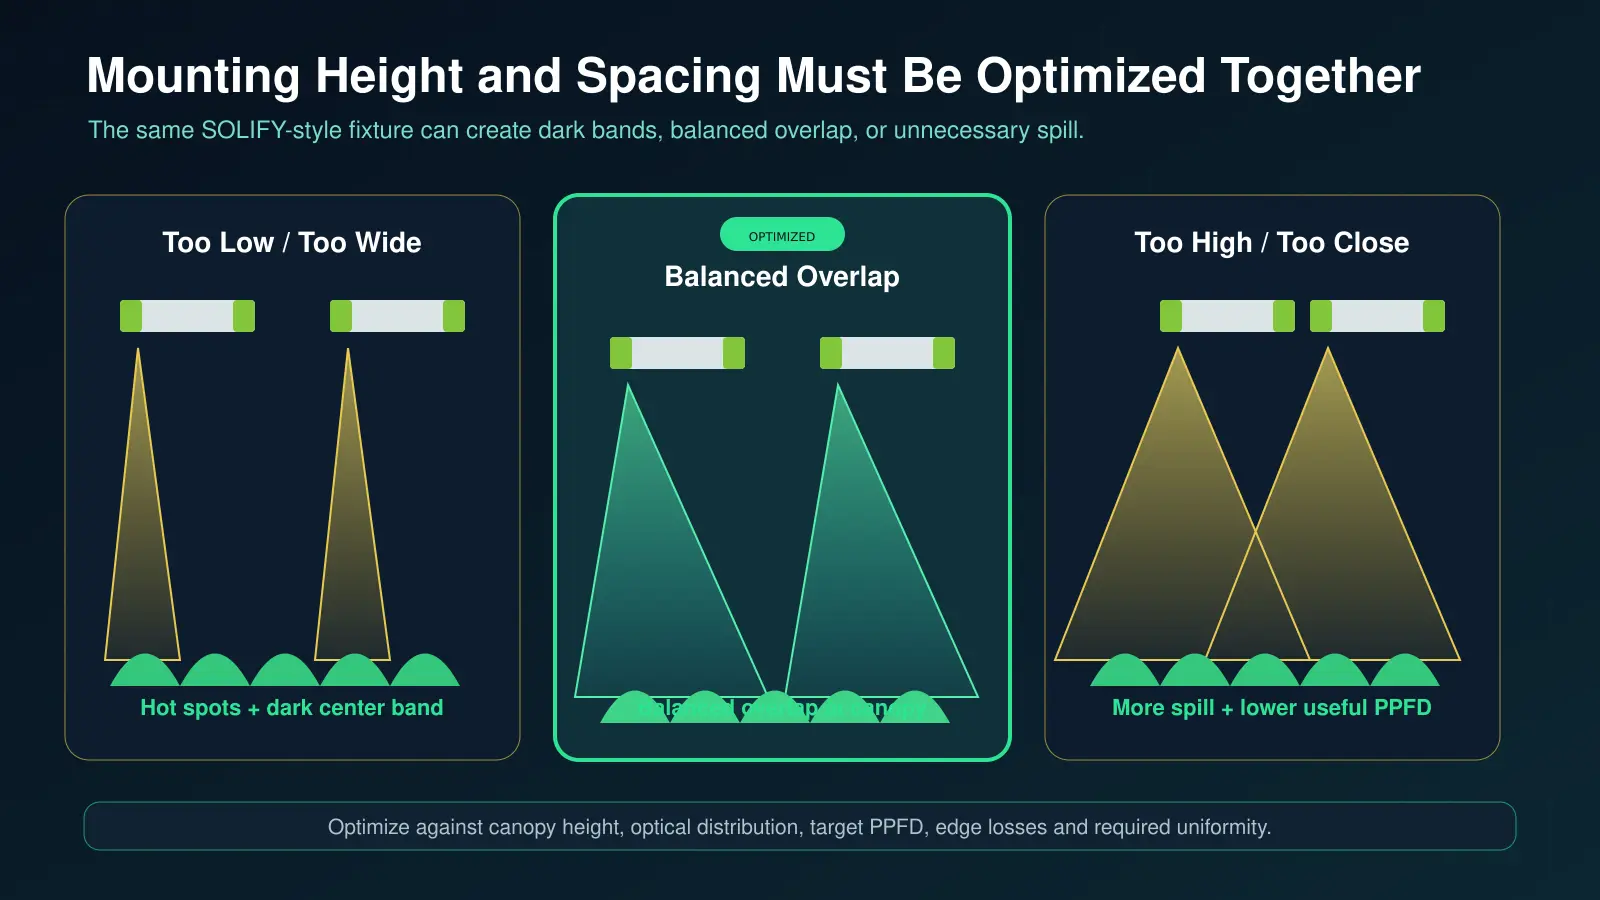
Optimize mounting height and fixture spacing together because each changes beam overlap, local intensity, spill and uniformity. There is no universal rule such as “one fixture every two meters.” The correct spacing depends on the fixture’s distribution, its distance from the canopy, the target PPFD, the crop-area geometry, and the required uniformity.
| Design change | Likely benefit | Likely trade-off |
|---|---|---|
| Increase fixture-to-canopy distance | Broader overlap and often better uniformity | More spill and lower local PPFD; structural limits may apply |
| Decrease fixture-to-canopy distance | Higher local intensity and less travel distance | Greater risk of hot spots and stronger sensitivity to spacing |
| Reduce spacing | More overlap and improved minimum PPFD | More fixtures, wiring, capital cost, and connected load |
| Increase spacing | Lower fixture count and installation cost | Higher risk of dark bands between fixtures |
| Use wider distribution | Better lateral coverage at suitable heights | Potential boundary losses near walls and aisles |
Run the model at both the lowest and highest expected canopy positions. A layout that is uniform for young plants can become non-uniform as the canopy rises and the fixture-to-canopy distance decreases.
Which Layout Pattern Matches the Crop Area?
Choose the pattern that follows the actual crop geometry, operational zones and mounting constraints. Common patterns include a rectangular grid for continuous canopies, row-aligned placement for crops grown in defined beds, staggered rows to reduce repeating dark bands, and separately controlled zones for benches or research compartments.
Do not treat the entire greenhouse floor as productive area if aisles, work zones, or empty borders do not require the same PPFD. Conversely, do not exclude edges simply to improve the reported average. Define the calculation area before simulation and report any excluded boundary band.
Edges and corners typically receive less overlap than the center. Possible responses include moving the outer row inward, adding selected edge fixtures, using a different optic, reducing output in the center, or dividing perimeter fixtures into a separate dimming zone. The best choice depends on crop value, energy cost, and how much boundary area is actively planted.
How Should a Greenhouse Lighting Layout Report PPFD Uniformity?
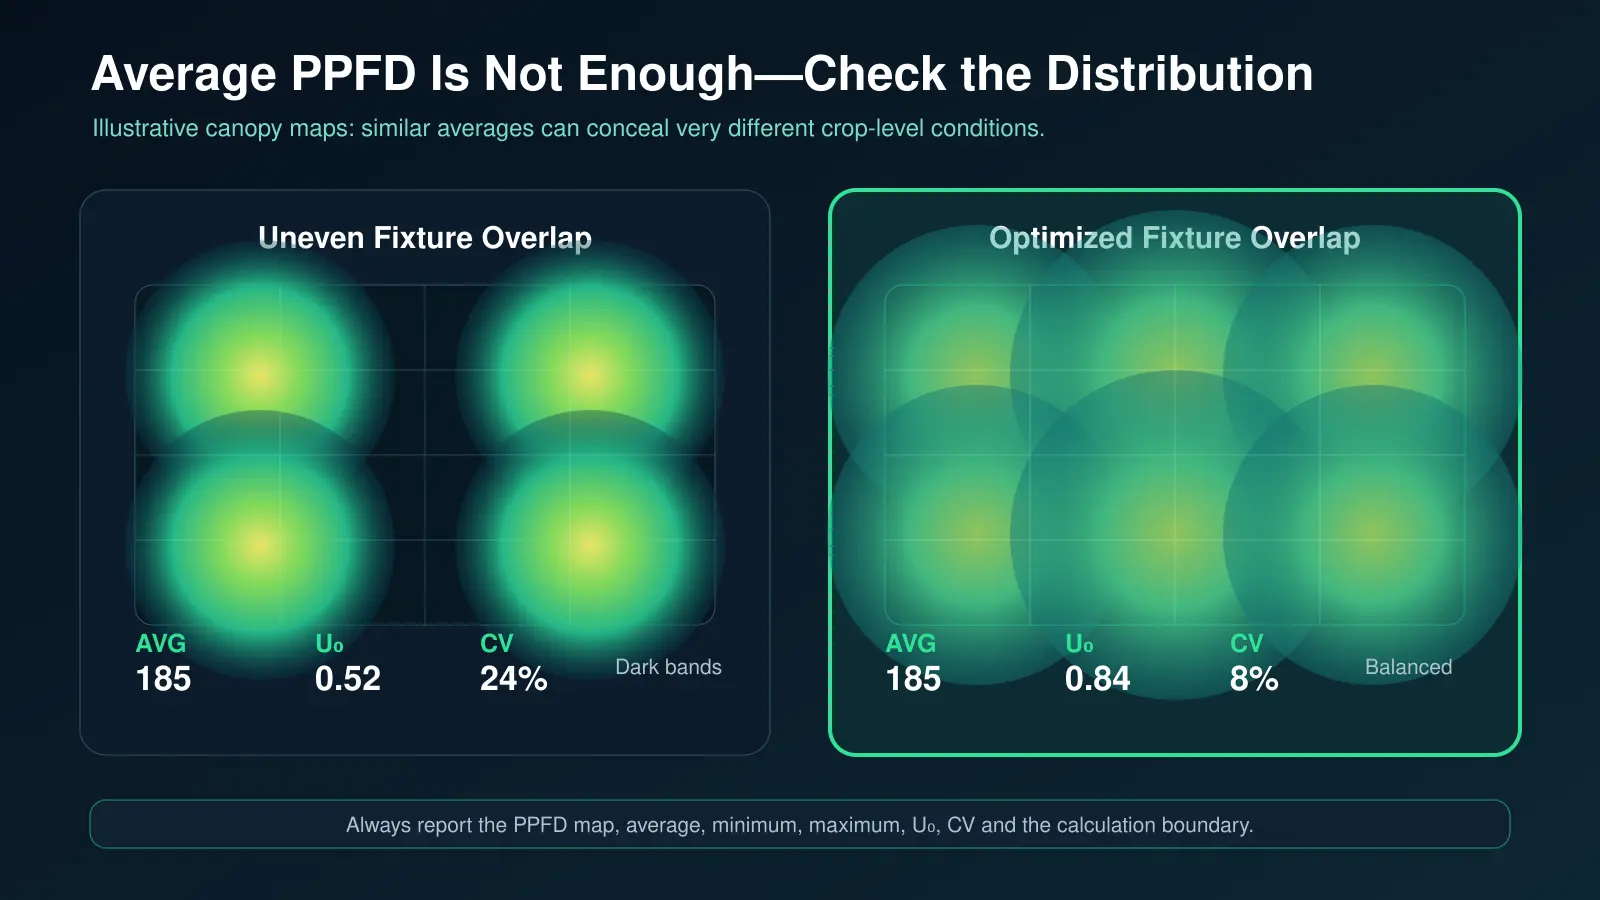
Report the complete canopy-level PPFD map with average, minimum, maximum, U0, CV, calculation boundary and test conditions—not the average alone. An average PPFD can meet the target while part of the crop remains under-lit. See the detailed greenhouse PPFD uniformity guide for the measurement protocol, worked calculation, diagnosis and acceptance framework.
Two useful indicators are:
For example, an average of 185 μmol·m−2·s−1 and a minimum of 150 gives U0 = 0.81. Whether that is acceptable depends on the crop, production objective, boundary definition, and project specification.
There is no single uniformity threshold for every greenhouse. Commercial production may accept more variation than a controlled experiment. The Illuminating Engineering Society review notes that 10–20% intensity variation is often cited as generally acceptable, while tighter research or plant-factory applications may target approximately ±5%. Treat these as context, not a universal guarantee.
For research greenhouses, also report the individual measurement points, standard deviation, edge behavior, sensor position, and test conditions. A single ratio cannot show whether non-uniformity occurs as isolated hot spots, dark rows, or a systematic center-to-edge gradient.
How Should Structural Shadows and Sunlight Be Modeled?
Model the real greenhouse structure and evaluate electric light separately from representative combined-light conditions. Greenhouse trusses, gutters, screens, heating pipes, irrigation booms, cables, and crop-support systems can block or redirect light. A clean rectangular model that omits these elements may overstate both average PPFD and uniformity.
Evaluate electric light separately from sunlight so the fixture layout can be compared consistently. Then evaluate representative combined-light conditions for operation and control. Electric-only verification is commonly performed when sunlight is absent or negligible; otherwise changing sunlight can distort the PPFD map.
The seasonal operating strategy also matters. During bright months, fixtures may dim or switch off by zone; in winter and cloudy seasons, the same layout may operate closer to full output for longer periods.
How Should Control Zones Follow the Physical Layout?
Define control zones while the physical layout is being designed, using crop type, compartment, sunlight exposure, fixture orientation and operational needs as the boundaries. Controls should not be added after fixture placement is complete.
A good zone plan can support:
- different PPFD targets for different crops or growth stages;
- compensation for east–west or perimeter light differences;
- sunlight-responsive dimming;
- DLI-based operation;
- research treatments and control groups;
- maintenance without shutting down the full greenhouse.
Explore the HARVESTATION lighting-control system for zone-based dimming and DLI-oriented greenhouse operation.
How Do You Verify the Installed Greenhouse Lighting Layout?
Verify the installed layout with a repeatable canopy-level PPFD grid under documented lighting conditions. Simulation predicts performance; field measurement confirms it. Measure on a horizontal plane at the actual canopy height using a suitable calibrated quantum sensor.
- Record fixture model, dimming level, voltage, operating status, and warm-up condition.
- Eliminate or document sunlight during electric-light verification.
- Use evenly spaced measurement points and include edges and corners.
- Keep the sensor level, unobstructed, and at the defined canopy plane.
- Calculate average, minimum, maximum, U0, and CV.
- Compare the measured map with the design and investigate systematic differences.
- Repeat after major changes to fixture height, crop geometry, screens, or greenhouse equipment.
Purdue Extension recommends measuring light near the crop with a quantum sensor and recording readings over time when DLI is required. For installed-system acceptance, document the sensor, grid, test time, environmental conditions, and any excluded points so results can be reproduced.
Common Greenhouse Lighting Layout Mistakes
Starting with a fixed fixture spacing
Spacing is an output of the design process, not a universal input. It must be solved together with height, distribution, output, and target uniformity.
Using total greenhouse floor area
Aisles and service zones can distort the photon-balance estimate. Define the actual lit canopy area and the boundary used for uniformity calculations.
Reporting only average PPFD
Always include the minimum, maximum, uniformity metric, grid spacing, and PPFD map.
Ignoring the mature canopy
Fixture-to-canopy distance changes during the crop cycle. Test the critical canopy positions.
Ignoring obstructions and edges
Trusses and boundary losses can turn a visually regular grid into an uneven crop-level result.
Treating the simulation as the final result
Simulation assumptions must be checked against the installed system with canopy-level measurement.
Greenhouse Lighting Layout Checklist
- Crop, growth stage, and production target defined
- Target DLI and supplemental PPFD documented
- Lit canopy area separated from aisles and service zones
- Canopy-height range and mounting limits confirmed
- Structure and equipment included in the model
- Fixture PPF, distribution file, dimming, and environmental ratings verified
- Fixture quantity supported by photon balance and simulation
- Average PPFD, minimum PPFD, U0, CV, and map reported
- Edges, corners, and zone boundaries reviewed
- Electrical load, wiring, access, and controls coordinated
- Field-verification grid and acceptance criteria agreed before installation
FAQ: Greenhouse Lighting Layout
How far apart should greenhouse LED grow lights be?
There is no universal spacing. It depends on fixture distribution, mounting height above the canopy, target supplemental PPFD, crop-area geometry, and uniformity requirement. Final spacing should be based on photometric simulation and verified by a canopy-level PPFD map.
What is the best mounting height for greenhouse grow lights?
The best height provides enough overlap for uniformity while limiting spill and fitting the structure. Evaluate the distance from fixture to both the young and mature canopy, not only the distance from fixture to floor.
How many LED grow lights does a greenhouse need?
A first estimate can divide the total canopy photon requirement by usable fixture PPF, but the final count must account for distribution, height, edges, obstructions, zoning, and the modeled utilization factor.
What PPFD uniformity should a greenhouse target?
The target should be agreed for the crop and application. Commercial production and research greenhouses may need different limits. Report the metric and calculation area explicitly rather than claiming a universal threshold.
Should sunlight be included in the lighting layout simulation?
Evaluate electric lighting separately for a stable comparison, then evaluate representative combined-light conditions for operation. For acceptance testing of the electric system, measure when sunlight is absent or negligible, or document and correct for it.
Can wattage be used to compare greenhouse lighting layouts?
No. Wattage describes electrical input. Greenhouse layouts should be compared by canopy-level PPFD, DLI contribution, uniformity, fixture PPF and PPE, power demand, controls, and verified operating conditions.
MarsEVOL Perspective: From Crop Target to Verified Layout
MarsEVOL approaches greenhouse lighting as a connected design process: crop target → sunlight and DLI deficit → supplemental PPFD → fixture selection → layout simulation → uniformity optimization → zoning and controls → field verification.
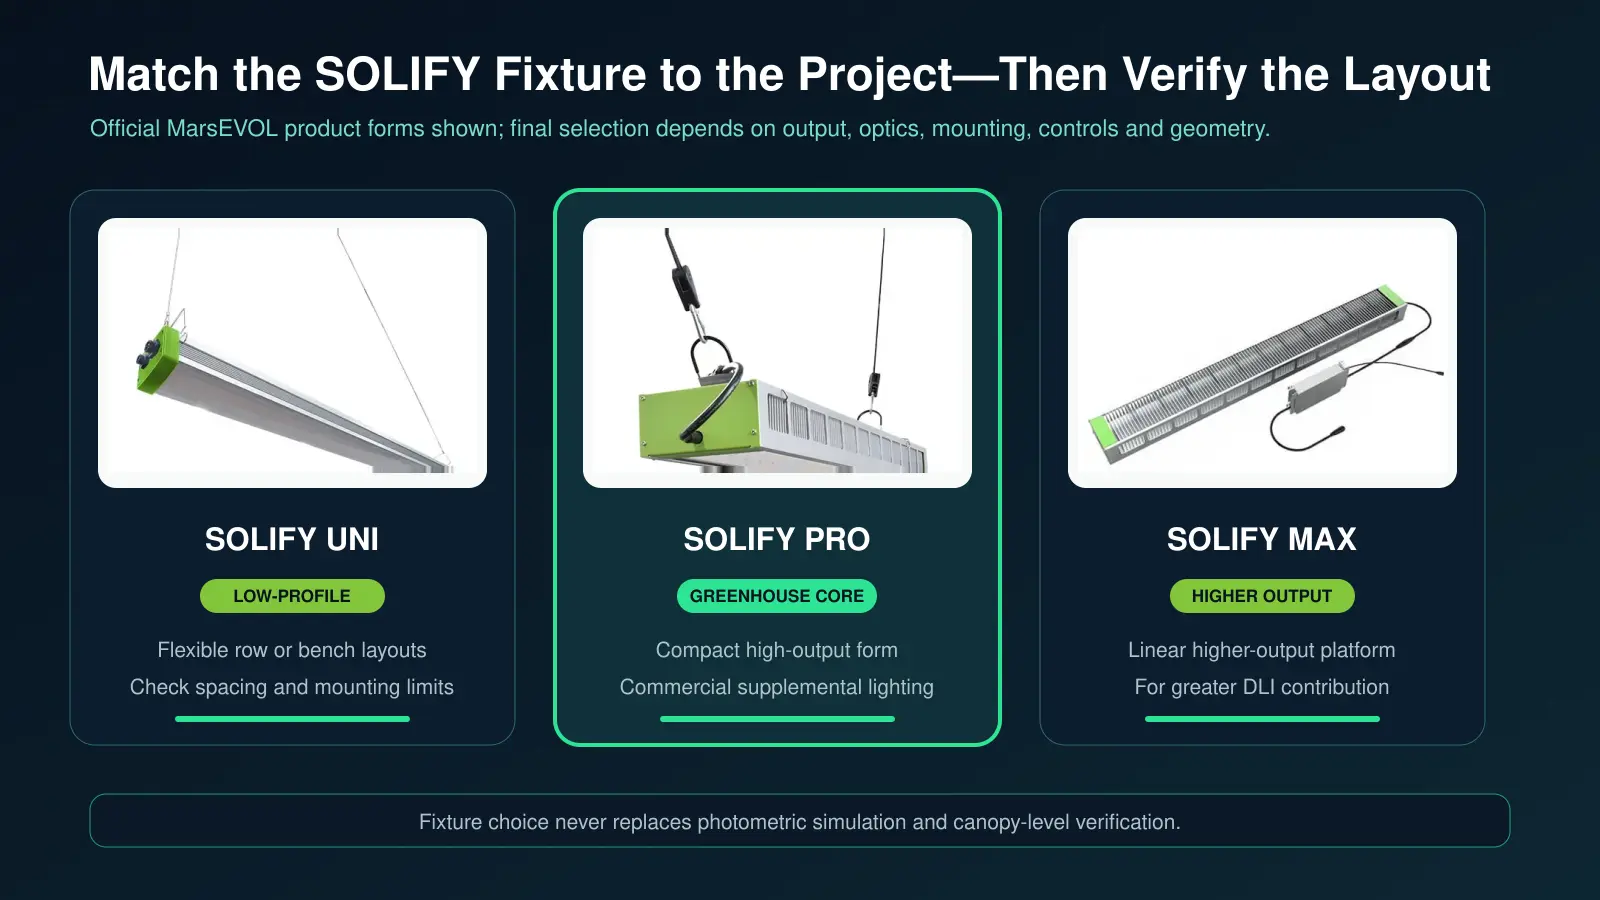
The SOLIFY greenhouse lighting range supports commercial and research greenhouse projects with different output and installation requirements. Our greenhouse lighting planning support can include fixture selection, layout concepts, PPFD simulation, uniformity review, and control recommendations.
Conclusion
A professional greenhouse lighting layout is not a fixed grid or a universal spacing rule. It is a verified engineering result that connects crop DLI, supplemental PPFD, greenhouse geometry, fixture distribution, mounting height, spacing, uniformity, control zones, and field measurement. Start with the crop target, model the complete system, and confirm performance at the actual canopy before final acceptance.
Need a Verified Greenhouse Lighting Layout?
Share the crop, greenhouse dimensions, canopy height, target PPFD or DLI, available drawings, and control requirements.
Explore More MarsEVOL Greenhouse Lighting Resources
See how crop targets, PPFD simulation, fixture architecture and controls are combined in project-level greenhouse design.
Compare the SOLIFY UNI, PRO and MAX product forms for different output and installation requirements.
Review zone dimming, sunlight-aware operation and DLI-oriented greenhouse control.
References
- American Society of Agricultural and Biological Engineers. ANSI/ASABE S640: Quantities and Units of Electromagnetic Radiation for Plants.
- American Society of Agricultural and Biological Engineers. ANSI/ASABE S644:2025—Design of Electromagnetic Radiation Systems for Plants.
- Torres, A. P., and Lopez, R. G. Measuring Daily Light Integral in a Greenhouse. Purdue Extension.
- Resource Innovation Institute. Controlled Environment Agriculture Lighting Best Practices Guide.
- Ashdown, I., and Descoteaux, M. Lighting Uniformity in Horticulture. Illuminating Engineering Society FIRES, 2022.
- Harbick, K., and Mattson, N. S. Optimization of Spatial Lighting Uniformity Using Non-Planar Arrays and PPFD Modulation. Acta Horticulturae 1337, 2022. DOI: 10.17660/ActaHortic.2022.1337.14.