
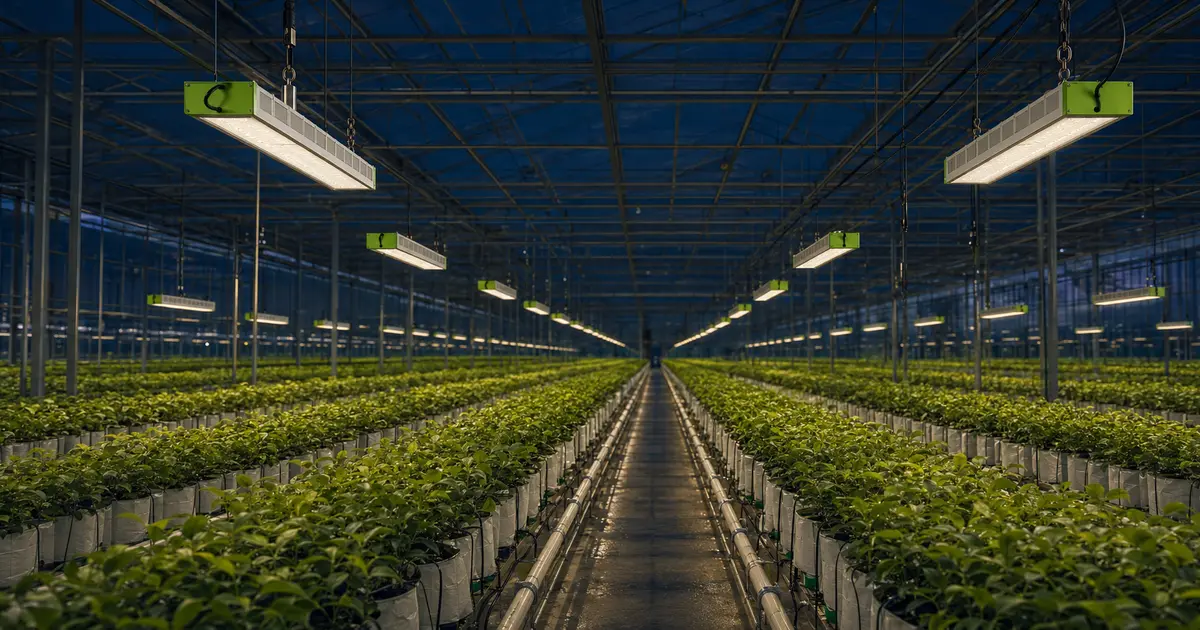
Greenhouse grow light spacing cannot be set by one universal distance. Start with the selected fixture’s verified light distribution, the target supplemental PPFD and the minimum fixture-to-mature-canopy clearance. Create a trial grid, model average and minimum PPFD plus edge losses, then adjust mounting height, along-row spacing, cross-row spacing and dimming zones. Verify the installed result with a canopy-level quantum-sensor grid.
Key Takeaways
- Measure mounting height from the fixture to the crop canopy—not to the floor.
- Height and spacing are coupled: changing either changes intensity, overlap, spill and uniformity.
- Use separate along-row and cross-row spacing when the fixture distribution or crop geometry is not symmetrical.
- A spacing-to-height ratio is useful for comparing trial geometries, but it is not a universal design limit.
- Model both young and mature canopy positions, then verify the installed layout under documented conditions.
Growers often ask for a distance such as “one fixture every two meters.” That request is understandable, but a distance alone cannot describe a lighting system. PPFD at the crop depends on fixture photon intensity distribution, spectrum, orientation, height above the canopy, neighboring-fixture overlap, greenhouse boundaries, structural shadows and the selected calculation area. If the PPFD and DLI terms are unfamiliar, first review how PPFD and DLI work together.
Why Is There No Universal Greenhouse Grow Light Spacing?
There is no universal spacing because two fixtures with the same wattage or PPF can distribute photons differently. A broad distribution may support wider overlap at a suitable height, while a narrower distribution can create high values beneath each fixture and dark bands between rows. Greenhouse geometry and planted boundaries then change the result again.
ANSI/ASABE S640 standardizes radiation quantities such as PPF and PPFD, while ANSI/ASABE S644:2025 establishes performance criteria for designing radiation systems for plants. Neither turns fixture wattage into a universal meter rule. A defensible design must connect the selected fixture’s distribution with the actual application.
Research reinforces this point. Ciolkosz, Both and Albright found that luminaire selection and placement affect uniformity at the center and perimeter of greenhouses. Harbick and Mattson later showed that regular planar arrays can produce a “bullseye” pattern—higher PPFD in the interior and lower PPFD at edges and corners—especially in smaller greenhouse or research areas.
Which Dimensions Control Mounting Height and Spacing?
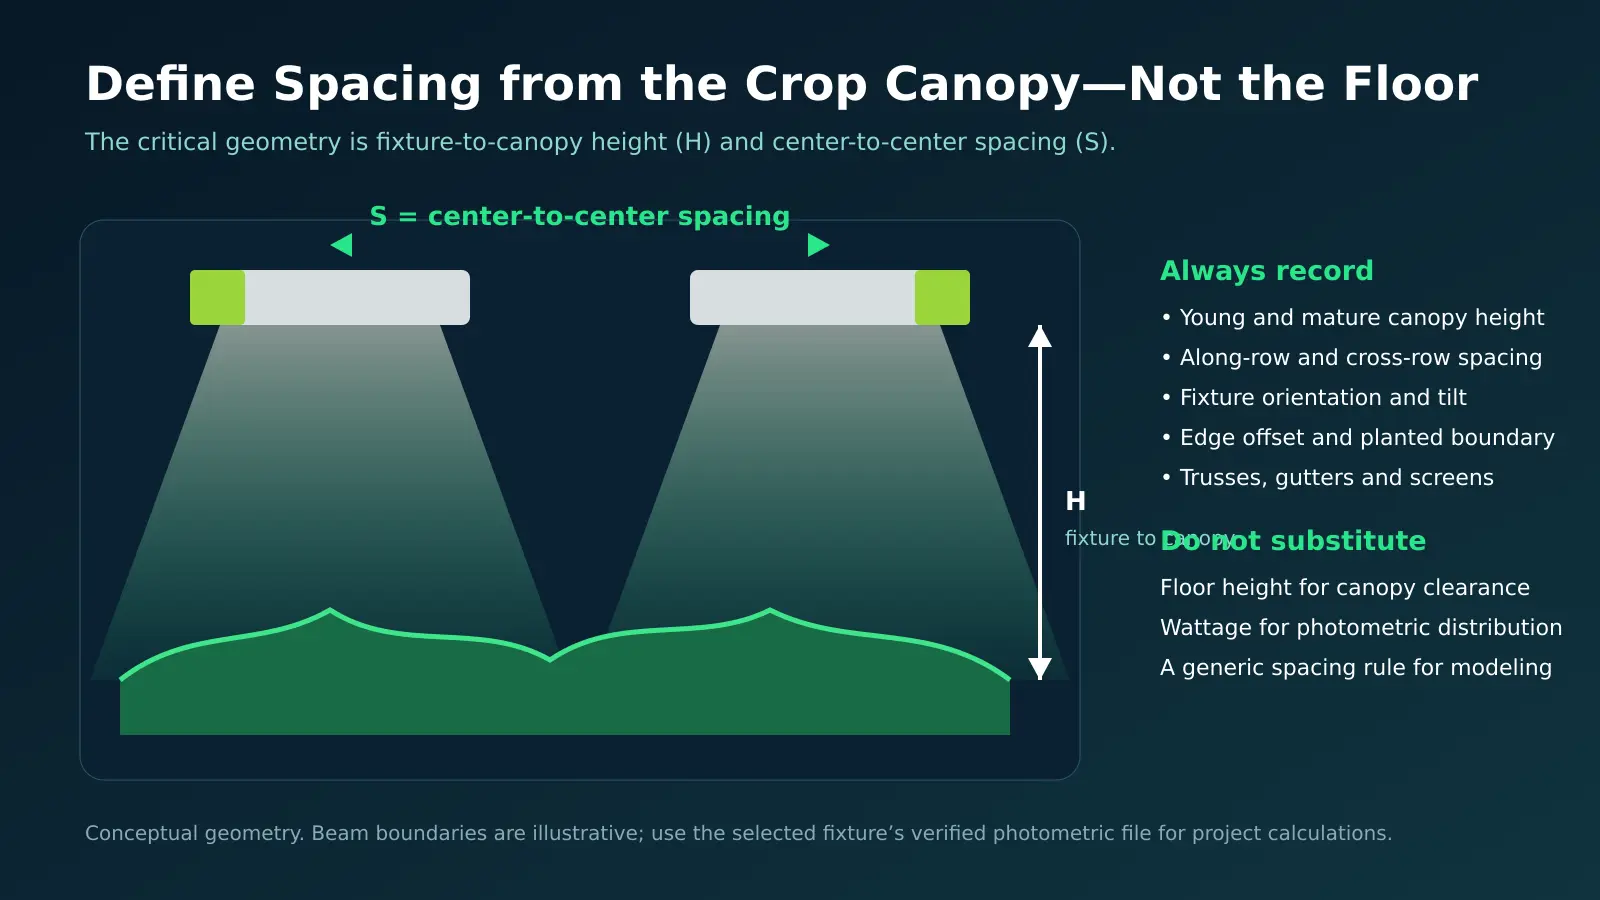
The critical dimensions are fixture-to-canopy height, center-to-center spacing in two directions and the offset from the crop boundary. Record them at the same crop stage used for design acceptance.
| Input | Design notation | Why it matters |
|---|---|---|
| Fixture-to-canopy height | H | Controls distance, beam spread, local intensity and sensitivity to spacing |
| Along-row spacing | Sx | Controls overlap parallel to the luminaire or crop row |
| Cross-row spacing | Sy | Controls overlap between fixture or crop rows |
| Edge offset | Ex, Ey | Determines how planted boundaries are treated |
| Canopy-height range | Hyoung, Hmature | Shows how clearance changes during the crop cycle |
| Orientation | Rotation/tilt | Aligns directional distribution with beds, bays or rows |
Do not substitute greenhouse eave height or fixture height above the floor for H. As crops grow, the canopy moves closer to the luminaire even when the suspension point is unchanged. The Illuminating Engineering Society illustrates how a change in canopy height can materially change uniformity in a fixed installation.
How Does Mounting Height Change Canopy PPFD?
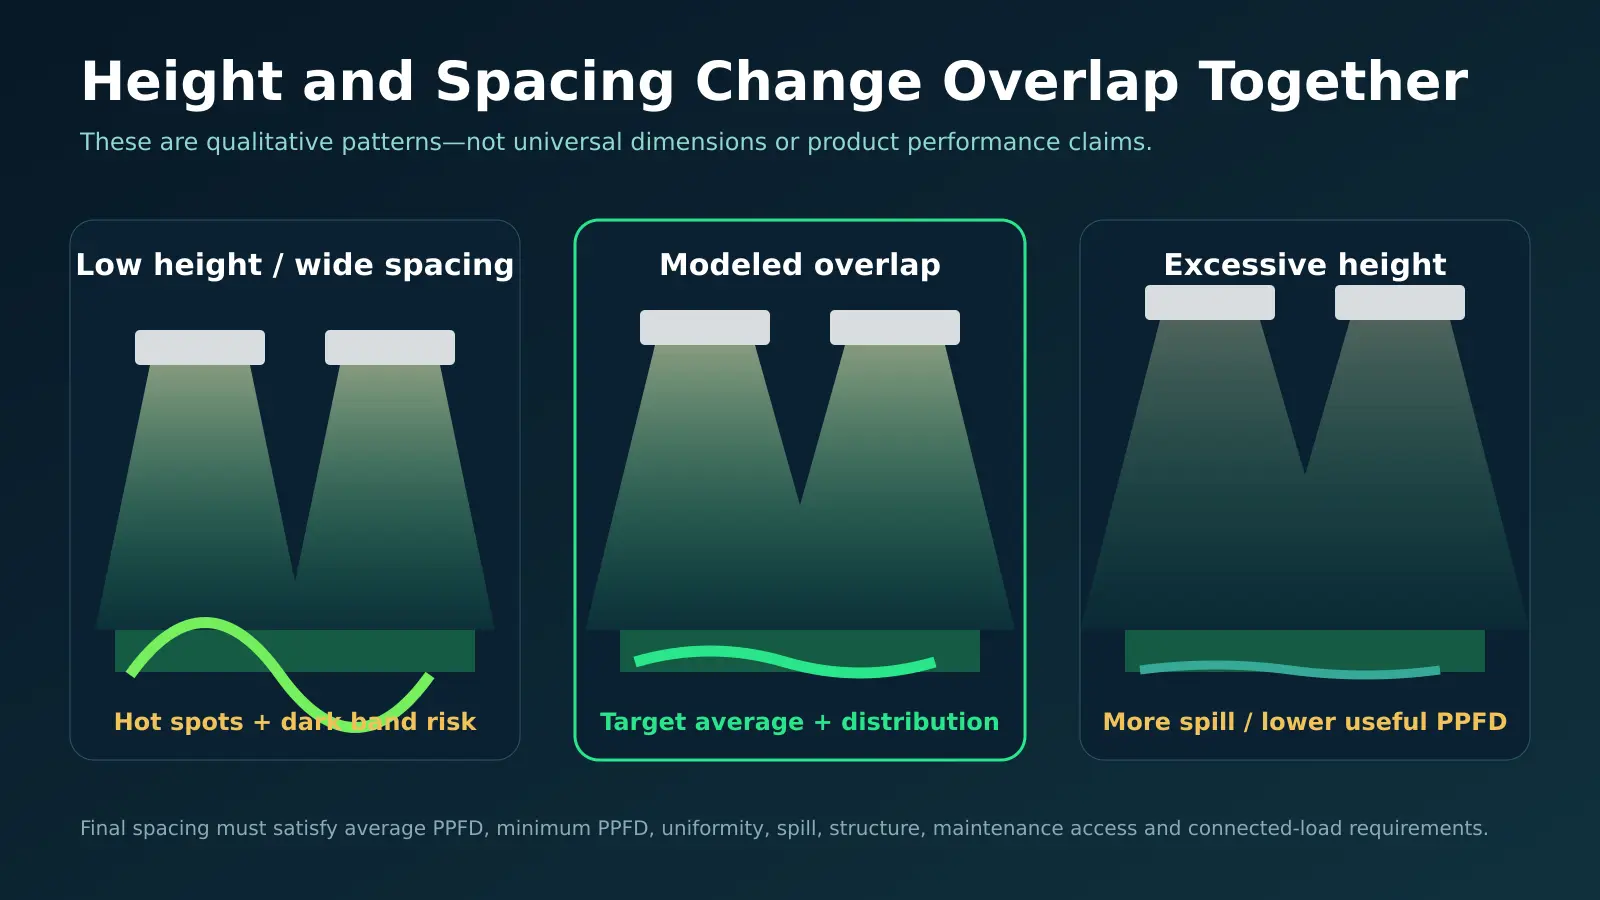
Increasing height normally broadens overlap but reduces local intensity and can increase spill; decreasing height normally raises local PPFD but makes the layout more sensitive to spacing. The actual response depends on the fixture’s angular photon distribution and neighboring fixtures.
For a calculation point sufficiently far from a luminaire relative to the luminous opening, Harbick and Mattson describe the photometric relationship as:
This equation explains why distance matters, but it is not a hand-calculation substitute for a complete grid. The directional intensity I(φ) must come from verified fixture photometric and spectral data. Reflections, obstructions and greenhouse boundaries may also need to be represented.
Should fixtures simply be mounted as high as possible?
No. Excessive height can spread photons beyond the planted area, reduce useful PPFD and increase structural, installation or maintenance difficulty. The goal is not maximum height; it is the height-and-spacing combination that satisfies crop-level intensity, distribution, spill and practical constraints.
How Do You Set a Trial Greenhouse Grow Light Spacing?
Set an initial spacing only after defining the crop target, canopy range and fixture distribution. Then treat that grid as a model input to be revised—not as the final bill of materials.
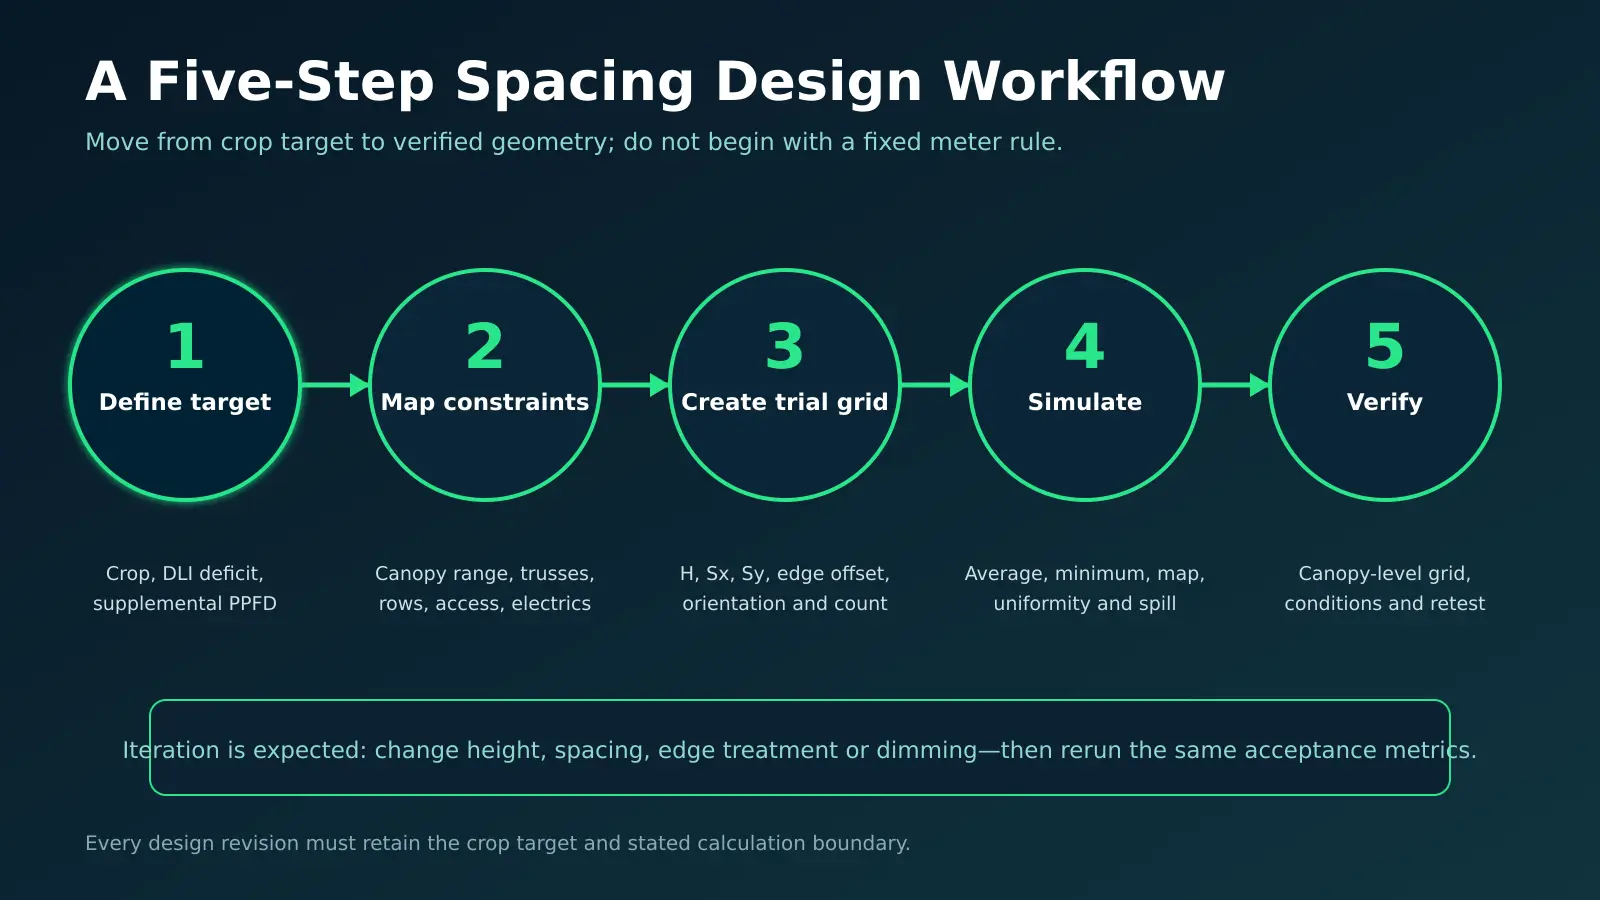
- Define the supplemental-light target. Establish the crop and production objective, target DLI, available greenhouse sunlight, operating window and required electric-light PPFD.
- Map physical constraints. Record the planted area, crop rows, young and mature canopy heights, trusses, gutters, screens, irrigation booms, electrical routes and service clearances.
- Select the fixture and orientation. Use verified output, spectrum and distribution data. Align a directional fixture deliberately with the crop geometry.
- Create a trial grid. Set H, Sx, Sy and edge offsets. Coordinate fixture positions with structure and controls.
- Simulate and iterate. Compare average and minimum PPFD, uniformity, hot spots, dark bands, edge losses, spill, connected load and zone behavior.
- Verify after installation. Measure at the actual canopy plane with a quantum-sensor grid and document test conditions.
Can a spacing-to-height ratio be used?
Yes, as a normalized comparison between trial layouts—but not as a universal pass/fail rule.
When the mature canopy rises, H decreases while the physical spacing remains fixed, so SHR increases. That is one reason a layout that appears acceptable for young crops can develop stronger hot spots or bands later.
Worked Example: How Do You Convert Spacing into a Trial Fixture Count?
Divide each crop-area dimension by the proposed spacing and round upward when using a centered grid with edge offsets no greater than half the spacing. This calculation establishes positions only; it does not prove that the proposed fixtures achieve the target PPFD.
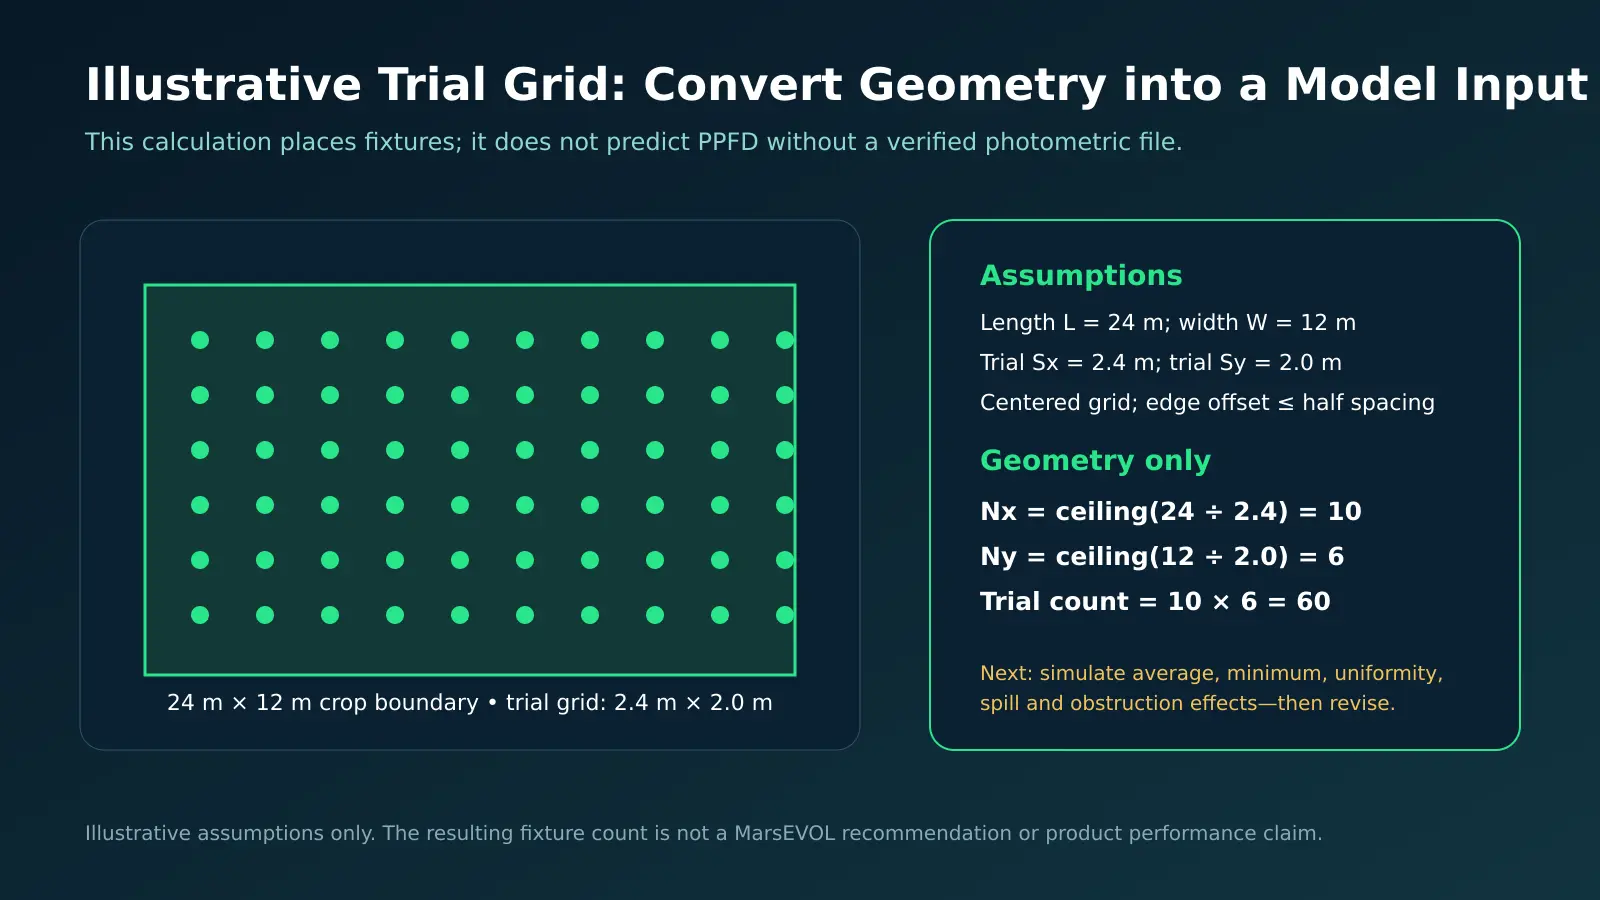
Assume:
- Crop boundary: 24 m long × 12 m wide
- Trial along-row spacing Sx: 2.4 m
- Trial cross-row spacing Sy: 2.0 m
- Centered layout with each edge offset no greater than half the relevant spacing
The next step is to model those 60 positions using the chosen fixture file. If the average is too low, adding fixtures is only one response; height, orientation, optics and spacing may also change. If the center is high and edges are low, simply increasing every fixture’s output can worsen the pattern.
What Must a Greenhouse Lighting Spacing Simulation Check?
A spacing simulation must check the full canopy map, not only the average. It should use the same crop boundary, fixture output and canopy plane that will appear in the proposal.
| Output | Question answered | Design risk if omitted |
|---|---|---|
| Average PPFD | Does the electric system meet the planned mean contribution? | System may be uniformly under-lit |
| Minimum and maximum PPFD | Where are the darkest and brightest points? | Local crop risk is hidden by the mean |
| PPFD map and uniformity | Are there bands, hot spots or edge gradients? | Irregular distribution is missed |
| Young and mature canopy planes | How does crop growth change clearance? | A single-stage design may fail later |
| Obstructions | Do trusses, gutters and screens create shadows? | Clean models overstate performance |
| Spill outside crop boundary | How much output misses planted area? | Energy and fixture count are misallocated |
| Connected load and zones | Can the design be powered and controlled as intended? | Layout conflicts with electrical reality |
Greenhouse covering and screens affect the sunlight component and may influence the required supplemental target; use the MarsEVOL guide to greenhouse covering light transmission when defining project assumptions. For variable daily operation, connect the modeled electric-light contribution with the supplemental lighting runtime method.
How should edges and corners be treated?
Define the planted boundary before simulation and evaluate edges explicitly. Interior calculation points receive contributions from more neighboring fixtures. Harbick and Mattson improved a research-greenhouse layout by relaxing regular planar placement and adding light where the original design was darkest. Practical responses may include moving outer rows, changing edge offset, using a different distribution, adding selected perimeter positions or creating a separate dimming zone.
How Do You Verify Mounting Height and Spacing After Installation?
Verify the system with a documented canopy-level PPFD grid under stable lighting conditions. Record the fixture output, active zones, canopy height, sensor model, measurement coordinates, greenhouse screens, obstructions and the presence or absence of sunlight.
- Confirm installed H, Sx, Sy, orientation and edge offsets against the approved drawing.
- Set the system to the documented commissioning output.
- Measure PPFD on the agreed grid with a suitable quantum sensor kept level and unobstructed.
- Calculate average, minimum, maximum and the agreed uniformity metrics.
- Compare the measured spatial pattern with the simulation—not only one summary number.
- Investigate systematic differences before changing setpoints or accepting the system.
Retest after a material change to suspension height, fixture positions, optics, dimming zones, screens or other equipment that affects the crop light field.
Common Mounting Height and Spacing Mistakes
Using one number from another greenhouse
A distance that worked elsewhere may use a different fixture, crop area, height, optic, target PPFD or boundary.
Measuring height to the floor
The relevant clearance is fixture to crop canopy, including the mature canopy position.
Assuming higher mounting always improves uniformity
Higher mounting can broaden overlap, but it can also lower useful PPFD and increase spill.
Using fixture wattage to set spacing
Wattage is electrical input. It does not define photon output or angular distribution at the crop.
Ignoring perimeter and structural shadows
Regular grids can still produce dark boundaries and bands beneath gutters or trusses.
Skipping field verification
Installation tolerances, output settings and real obstructions can differ from the model.
FAQ: Greenhouse Grow Light Spacing
How far apart should greenhouse LED grow lights be?
There is no universal distance. Determine spacing from the selected fixture distribution, target supplemental PPFD, fixture-to-canopy height, crop geometry, uniformity criteria, edges and obstructions.
What is the best mounting height above a greenhouse crop?
The best height provides adequate overlap and target PPFD while limiting spill and fitting the greenhouse structure. Test both young and mature canopy positions in the photometric model.
Should spacing be measured edge-to-edge or center-to-center?
Lighting layouts normally document center-to-center fixture spacing. Also record the fixture dimensions, orientation and crop-boundary offset so the geometry is unambiguous.
Can the inverse-square law determine fixture spacing?
It explains the contribution from a source direction at a point, but a greenhouse grid receives light from many fixtures with angular distributions. Use verified photometric data and layout software for the complete result.
Does closer spacing always improve the crop?
No. Closer spacing may improve overlap but increases fixture count, capital cost, wiring and connected load. It can also oversupply average PPFD unless output or quantity is adjusted.
When should mounting height be rechecked?
Recheck it when the crop canopy rises, fixtures or suspension points move, screens or equipment change, or the measured PPFD pattern no longer matches the approved design.
MarsEVOL Perspective: Treat Spacing as a Verified Design Result
MarsEVOL approaches spacing through a connected chain: crop target → supplemental PPFD → fixture photometric distribution → canopy-height range → trial geometry → PPFD map and uniformity → zones and field verification. The SOLIFY greenhouse lighting range can support different greenhouse project forms, but the model and boundary conditions—not the product name alone—determine the final spacing.
MarsEVOL greenhouse lighting planning support can combine fixture selection, layout concepts, PPFD simulation and control recommendations. Where different bays or perimeter regions require separate output, the HARVESTATION smart lighting management system supports partitioned lighting control and sunlight/DLI-oriented operation.
Conclusion
Greenhouse grow light spacing is not a lookup-table answer. Define the crop target and mature-canopy clearance, use verified fixture distribution data, create a trial grid, simulate the entire planted boundary and iterate height and spacing together. Then confirm the installed system at canopy level. A professional spacing recommendation should always state its fixture, geometry, assumptions, calculation plane, metrics and verification method.
Need a Greenhouse Fixture Layout?
Share the crop area, canopy-height range, target PPFD or DLI, greenhouse drawings, mounting limits and control requirements for a preliminary project-oriented proposal.
Explore More MarsEVOL Resources
Connect crop DLI, available sunlight, supplemental PPFD, layout, uniformity and control strategy.
Explore engineering guides on DLI, PPFD, greenhouse transmission, runtime and supplemental-lighting decisions.
References
- American Society of Agricultural and Biological Engineers. ANSI/ASABE S640: Quantities and Units of Electromagnetic Radiation for Plants. ASABE, 2017.
- American Society of Agricultural and Biological Engineers. ANSI/ASABE S644:2025—Design of Electromagnetic Radiation Systems for Plants. ASABE, 2025.
- Ciolkosz, D. E., Both, A. J., and Albright, L. D. Selection and Placement of Greenhouse Luminaires for Uniformity. Applied Engineering in Agriculture 17(6), 2001. DOI: 10.13031/2013.6842.
- Harbick, K., and Mattson, N. S. Optimization of Spatial Lighting Uniformity Using Non-Planar Arrays and PPFD Modulation. Acta Horticulturae 1337, 2022. DOI: 10.17660/ActaHortic.2022.1337.14.
- Ashdown, I., and Descoteaux, M. Lighting Uniformity in Horticulture. Illuminating Engineering Society FIRES, 2022.
- Schipper, R. et al. Consequences of Intra-Canopy and Top LED Lighting for Uniformity of Light Distribution in a Tomato Crop. Frontiers in Plant Science 14, 2023. DOI: 10.3389/fpls.2023.1012529.