
Greenhouse PPFD uniformity describes how consistently photosynthetic photon flux density reaches the defined crop-canopy area. Do not assess a proposed LED layout from average PPFD alone. Report the measurement boundary, grid, minimum, mean and maximum PPFD, a clearly defined uniformity ratio such as U₀ = minimum / mean, and variation such as CV = standard deviation / mean. Compare like-for-like operating conditions, and verify simulated results with a calibrated canopy-level measurement after installation.
Key Takeaways
- Uniformity matters alongside average PPFD: two layouts with the same mean can expose crops to very different low-light areas.
- Always define the actual planted calculation area, crop-canopy plane, grid spacing, edge treatment and lighting operating state before quoting any ratio.
- U₀ and CV are useful complementary descriptors, but no single number is a universal horticultural pass/fail standard.
- Separate electric-light-only uniformity from combined daylight and supplemental light; the latter varies with time and weather.
- Use the same geometric and measurement basis for the supplier’s model, commissioning test and final acceptance.
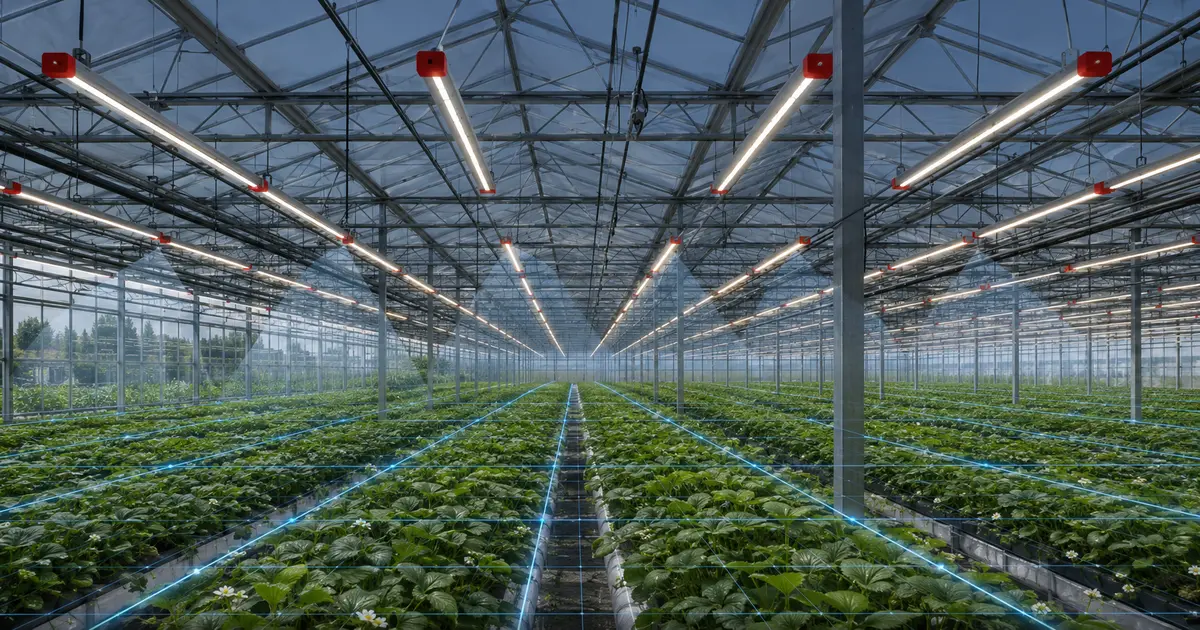
What Is Greenhouse PPFD Uniformity?
PPFD is the photosynthetic photon flux incident per square metre of a surface per second, commonly reported in μmol·m−2·s−1 for PAR (400–700 nm). Uniformity describes how widely those measured values vary across the designated crop area. It is a spatial measurement, not a fixture datasheet rating.
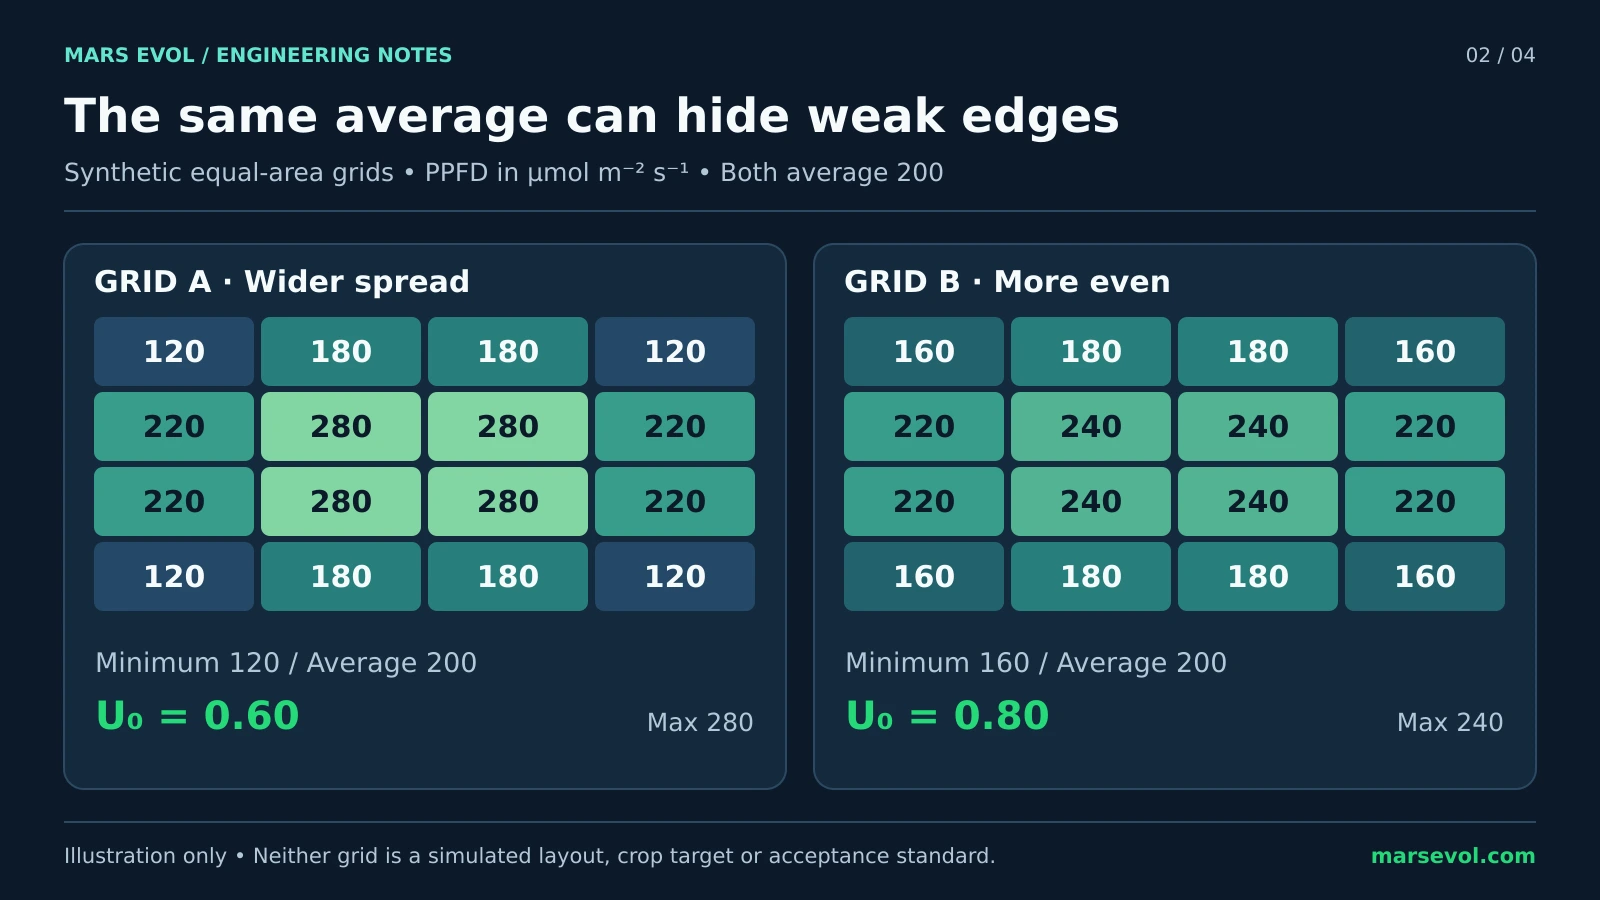
A proposed system may deliver the intended average PPFD yet leave crop rows, edges or benches with substantially less light. Such spatial differences can make crop management and comparative research more difficult. A greenhouse layout must therefore state both quantity (mean PPFD) and distribution (minimum, maximum and uniformity).
The US Department of Agriculture’s greenhouse lighting guidance and peer-reviewed research on greenhouse environmental measurements emphasize measuring across representative canopy locations, rather than under a single luminaire. For project-level target setting, see our greenhouse supplemental lighting framework.
Which PPFD Uniformity Metrics Should a Supplier Report?
Do not assume every supplier uses the same symbol. Explicitly write the formula in specifications and proposals. This article uses U₀ = minimum-to-average PPFD as a descriptive convention; other horticultural reports may use different names for similar ratios.
| Metric | Definition | How to interpret it |
|---|---|---|
| Average PPFD (P̄) | ΣPᵢ / n | Overall photon density for the sampled crop area |
| Minimum and maximum | min(Pᵢ) and max(Pᵢ) | Reveals low-light pockets and peaks |
| U₀ | Pmin / P̄ | Higher means the weakest sampled point is closer to the mean |
| CV | σ / P̄ × 100% | Lower means less relative spread across the complete sampled grid |
| Max / min ratio | Pmax / Pmin | Shows the range between the measured extremes |
U₀ = PPFDmin ÷ PPFDavg
CV (%) = 100 × σ ÷ PPFDavg
For equally weighted grid points: σ = √[Σ(Pᵢ − P̄)² / n]. For unequal sampled areas, apply area weighting or explain the sampling design.
Important: A single minimum point can make U₀ sensitive to a misplaced probe or isolated obstruction, while CV describes the spread of the whole dataset. Report both and retain raw readings. An agreed project acceptance criterion must identify the chosen metric, grid, operating case and tolerance; do not copy an architectural-lighting threshold into greenhouse contracts without technical justification.
Worked Example: A 16-Point Greenhouse PPFD Grid
The following is a synthetic teaching example—not a MarsEVOL laboratory test, product guarantee or site commissioning result. Assume 16 equal-area canopy grid cells, a stable electric-light-only operating condition and readings in μmol·m−2·s−1.
| 300 | 325 | 340 | 320 |
| 315 | 380 | 390 | 325 |
| 328 | 385 | 400 | 332 |
| 295 | 325 | 345 | 310 |
Grid values are illustrative. Color grouping is qualitative; read the actual numbers for calculations.
| Calculated statistic | Result |
|---|---|
| Number of points | 16 |
| Minimum PPFD | 295 μmol·m−2·s−1 |
| Maximum PPFD | 400 μmol·m−2·s−1 |
| Mean PPFD | 338.4 μmol·m−2·s−1 |
| U₀ = min / mean | 0.872 |
| Population standard deviation | 31.8 μmol·m−2·s−1 |
| CV | 9.4% |
For a constant 12-hour electric-light operating period, mean supplemental DLI from this illustrative grid is approximately 14.62 mol·m−2·d−1, while the lowest sampled point receives approximately 12.74 mol·m−2·d−1. Those DLI values exclude sunlight and assume constant PPFD; they are not the crop’s total daily light integral.
The calculation shows why the same average can conceal biologically relevant low-light locations. It does not establish whether U₀ = 0.872 passes an unspecified crop or research protocol.
How Should You Build a Canopy-Level PPFD Measurement Grid?
The measurement plan needs to be reproducible. A compact research bench and a multi-bay commercial greenhouse require different sampling layouts; there is no defensible universal grid count for every project.
- Define the boundary. Mark the planted footprint, rows, benches, aisles and any excluded non-growing area on a dimensioned drawing. Do not exclude poor-performing edge crops merely to improve uniformity.
- Specify the measurement plane. Measure at the intended crop-canopy height and state its elevation relative to a fixed structural reference. Record how canopy height may change during growth.
- Choose representative points. Use an evenly distributed grid (or documented stratified grid for irregular beds) that captures centers, edges and likely low-light zones. Record point coordinates and the area represented by each measurement.
- Document the source condition. For electric-light-only evaluation, test after dark or under a reliable daylight-exclusion method, with all relevant fixtures at defined output and after thermal stabilization. Do not treat mixed daylight readings as electric-only.
- Use suitable instrumentation. Use a calibrated quantum/PAR sensor appropriate to the fixture spectrum, level and orient the detector consistently, and log instrument model, calibration and measurement uncertainty.
- Retain raw values. Report coordinates, PPFD, fixture output settings, ambient conditions, timestamps, outliers and any obstructions. Keep both the field file and calculated summary.
When sun and LEDs both contribute to plant growth, measure and analyze the combined environment as a separate operating case. Daylight movement, glazing, shade screens and cloud conditions mean combined-light uniformity is time-dependent. For greenhouse experiments, also record light spill into neighboring treatment zones.
What Causes Poor PPFD Uniformity?
| Cause | Typical signature | Engineering response |
|---|---|---|
| Fixture spacing or mounting height | Alternating hot spots and dim gaps | Re-model photometry and spacing at actual canopy height |
| Greenhouse edges and aisle geometry | Low points at perimeter or uncovered crop strips | Evaluate edge fixture positions and asymmetric optics if appropriate |
| Trusses, pipes, curtains and hanging equipment | Repeating bands or localized shadows | Include obstructions in the model and test at representative positions |
| Mixed fixtures or driver settings | Uneven zones after dimming or replacement | Verify luminaire identity, grouping, calibration and control signals |
| Different plant heights / growth stages | Distribution changes as crops grow | Model at more than one canopy-height scenario |
| Uncontrolled daylight in the test | Measurements change rapidly with sun or clouds | Use controlled electric-only test or report time-stamped combined-light conditions |
Optical output distribution—not just total fixture PPF or luminaire count—determines canopy patterns. See our greenhouse lighting layout guide for fixture arrangement, spacing and mounting calculations.
Simulation Versus Field Measurements: What Must Agree?
A supplier’s simulation is a design prediction. A field PPFD map is a commissioning observation. Both are useful, but they must be compared under matching conditions.
| Parameter | Design model evidence | Field verification evidence |
|---|---|---|
| Fixture and output | Exact model, optical/photometric data, drive level | Installed SKU, driver setting, measured operating state |
| Geometry | Mounting coordinates, orientation and target plane | As-built positions and actual canopy-height record |
| Sampling | Calculation boundary, grid coordinates, point weighting | Same domain and documented physical grid |
| Obstructions | Structure and modeled shading assumptions | Observed trusses, screens, crop and equipment obstructions |
| Results | Raw predicted PPFD grid, P̄, Pmin, Pmax, U₀, CV | Raw measured grid with equivalent calculated metrics |
For buyer-side review of photometric provenance, calculation-area choices and commissioning evidence, read How to Validate a Greenhouse PPFD Map Before Buying Fixtures. Use the Greenhouse Lighting Calculator for preliminary energy, fixture and operating-hour estimates; it does not replace a project-specific spatial lighting model.
Greenhouse PPFD Uniformity: Installation Acceptance Checklist
Use this list when drafting a supply specification, comparing bids or preparing commissioning records. Establish project-specific minimum mean PPFD, uniformity criteria and tolerances before procurement.
- □ Crop, growth stage, planted area and intended measurement plane approved
- □ Electric-only and/or combined-light acceptance cases explicitly defined
- □ Exact product, optical file, quantity, dimming settings and mounting drawing recorded
- □ Measurement-grid coordinates, point count, spacing and area weighting approved
- □ Quantum sensor model, calibration, spectral compatibility and stabilization procedure recorded
- □ Minimum, mean, maximum, U₀ and CV reported with units and complete raw data
- □ Expected values, test tolerances, remediation responsibility and re-test procedure agreed
- □ Any departures from the design model documented and accepted by the project team
Acceptance note: A fixed numerical threshold is intentionally not imposed here. Acceptable spatial variability depends on crop sensitivity, whether the work is commercial production or replicated research, the sampling plan, acceptable costs and the contractual test basis. Specify the metric and threshold together, never the threshold alone.
Need a project-specific PPFD uniformity study?
For a commercial greenhouse, raised-bed retrofit or research facility, MarsEVOL can review the crop-light target, fixture arrangement, canopy grid and proposed commissioning evidence before an equipment decision.
Explore greenhouse lighting solutions | Request engineering support
FAQ: Greenhouse PPFD Uniformity
Is U₀ = 0.80 a universal greenhouse lighting standard?
No. The minimum-to-mean ratio is a useful descriptive metric, but its acceptance threshold must be defined for the crop, project type, measuring boundary and operating condition. Treat supplier claims of a universal threshold cautiously.
Can I use lux meter data to calculate PPFD uniformity?
A standard lux meter measures human-vision-weighted illuminance, not PPFD. Spectral differences can bias conversion to PPFD. A calibrated PAR/quantum sensor is preferable for verifying plant-lighting performance, especially across different spectra.
Why can the PPFD uniformity score change with canopy height?
Changing the distance and overlap between fixtures and the target plane changes the spatial photon distribution. Check the expected range of crop heights, not only the empty-bench level.
Should sunlight be included in PPFD uniformity testing?
Yes for studies of the combined crop-light environment, but it must be analyzed separately from electric-light-only equipment verification. Record time, weather, glazing and screen conditions so the results are interpretable.
Engineering References and Further Reading
- Illuminating Engineering Society — Lighting Uniformity in Horticulture. Context and limitations of uniformity metrics.
- Plant Methods — Guidelines for measuring and reporting environmental parameters for experiments in greenhouses. Canopy-plane measurements, sunlight separation and experimental reproducibility.
- Acta Horticulturae — Evaluation of Light Uniformity Underneath Supplemental Lighting Systems. Design considerations and spatial light distribution.
- Philips Horticulture — Comparing Lighting Designs. Calculation surface selection and supplier proposal comparisons.
- ANSI/ASABE S640 — Quantities and Units of Electromagnetic Radiation for Plants. Definitions of plant-radiation quantities and units; not a universal uniformity acceptance standard.
Prepared for engineering education and project planning. Illustrative numerical examples are not lab certification, a crop-specific lighting prescription, or a substitute for site measurements and contractual acceptance criteria.