
A purchasing-stage validation checklist that distinguishes simulated greenhouse PPFD values from measured performance and makes light-layout supplier proposals comparable. Start from project inputs, keep model assumptions traceable, and verify crop-level performance before commercial acceptance.
Key Takeaways
- A greenhouse lighting decision starts with the crop canopy, not a generic fixture count.
- Natural-light contribution, controls and geometry must be written as testable assumptions.
- Simulation outputs are preliminary until verified against installed equipment.
- Document acceptance criteria before purchase and record as-built evidence.
This guide explains greenhouse PPFD map for commercial growers, greenhouse builders, research facilities and lighting-system integrators. It focuses on engineering choices, realistic constraints and evidence that can be inspected before a purchase commitment. The intended reader is planning a real project, not comparing decorative indoor lamps.
For the broader system context, consult our greenhouse supplemental lighting framework, the engineering design inputs checklist and lighting schedule optimization discussion. The choices below must be reviewed against local electrical rules, the specific crop and the equipment data actually supplied.
What a PPFD map can and cannot prove
A greenhouse PPFD map represents a model of photosynthetic photon flux density across a chosen target plane. It can help buyers compare fixture layout alternatives, identify likely low-light edges and verify whether a supplier’s proposed arrangement is geometrically plausible. It cannot guarantee crop performance on its own. A map does not show how the crop responds to light, whether natural sunlight changes the balance or whether the installation will exactly match the drawing.
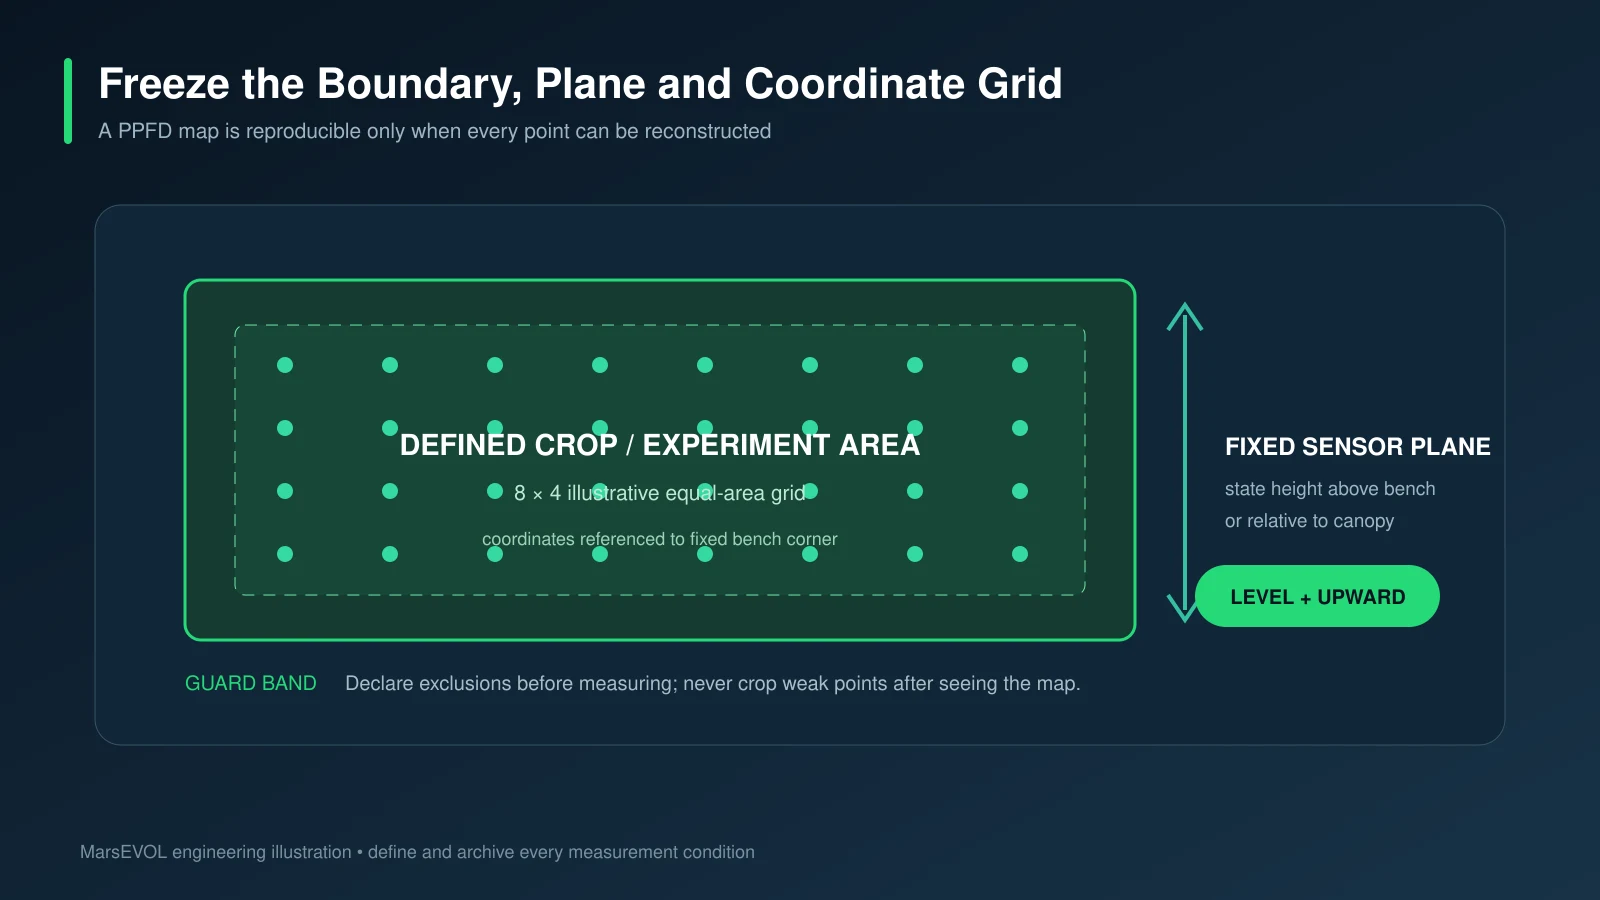
The first purchasing question should be what physical boundary the model represents. Is the colored footprint the planted crop area, a complete room, or a greenhouse bay including aisles? Is the target plane at floor level, empty-bed height or mature canopy? A visually smooth heat map can conceal a poorly defined calculation domain. Ask the supplier for a dimensioned basis document before relying on the average PPFD number in a proposal.
Check photometry provenance and fixture identity
Lighting software uses a photometric representation of the luminaire to predict photon distribution. The buyer should ask whether the supplier used an actual laboratory-characterized IES or equivalent distribution for the exact model, mounting configuration, driver setting and intended spectrum. A generic file may produce attractive graphics but does not establish the output of the equipment being quoted. Check software version, units, correction factors and whether the source file corresponds to an available product revision.
Do not accept a conversion from photometric lux to PPFD without a documented spectral assumption; the ratio varies with the spectral power distribution. Equally, a fixture’s published PPE and nominal PPF do not by themselves specify how photons are distributed over a canopy. A complete proposal links the precise luminaire data, optical distribution, mounting geometry and calculation model so an engineer can reproduce the result or at least trace its basis.
Validate the exact target plane and geometry
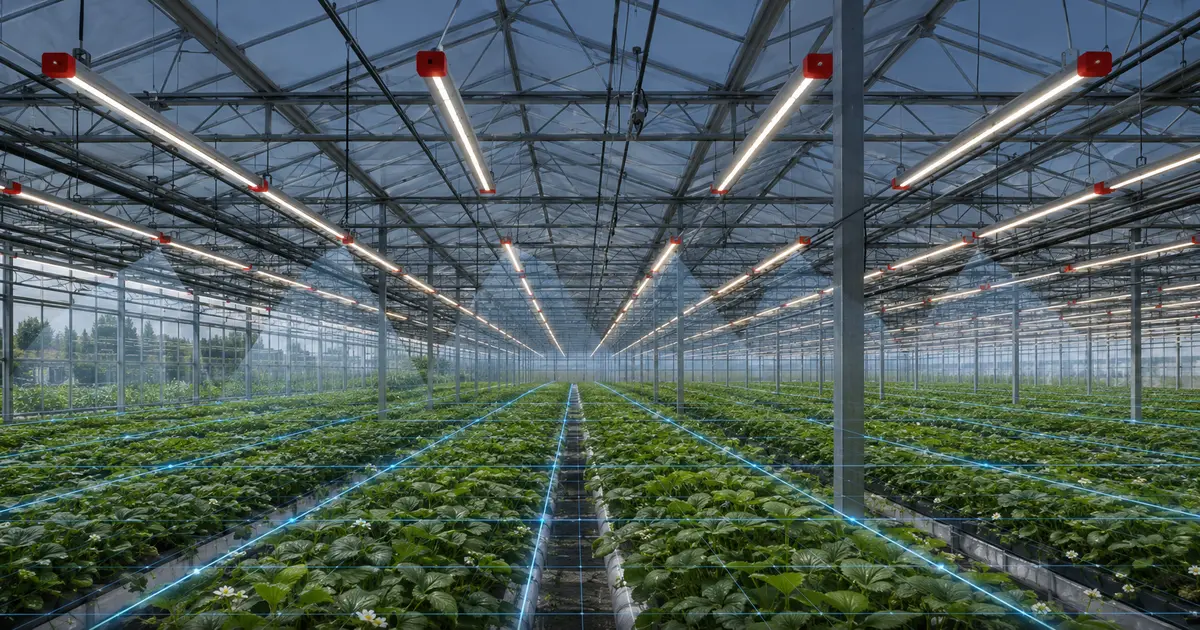
The distance between LEDs and canopy is central to simulated uniformity. Ask the supplier to show mounting elevations relative to both greenhouse structure and crops, including expected changes as canopies grow. Include trusses, screens, gutters, grow pipes, trellis cables and maintenance clearances. Irregular bay spacing, partial rows, raised beds and sidewall obstructions can have greater practical impact than another decimal place in the simulated average.
Provide scaled plan and section drawings with fixture orientation and suspension details. Confirm that the protected light-emitting surface faces the canopy and that the intended aiming is achievable without rotating or mirroring a fixture incorrectly. If the proposal is for supplemental lighting, record the basis for sunlight and glazing effects separately rather than silently adding hypothetical daylight to an electric-only map.
Insist on the distribution behind the average
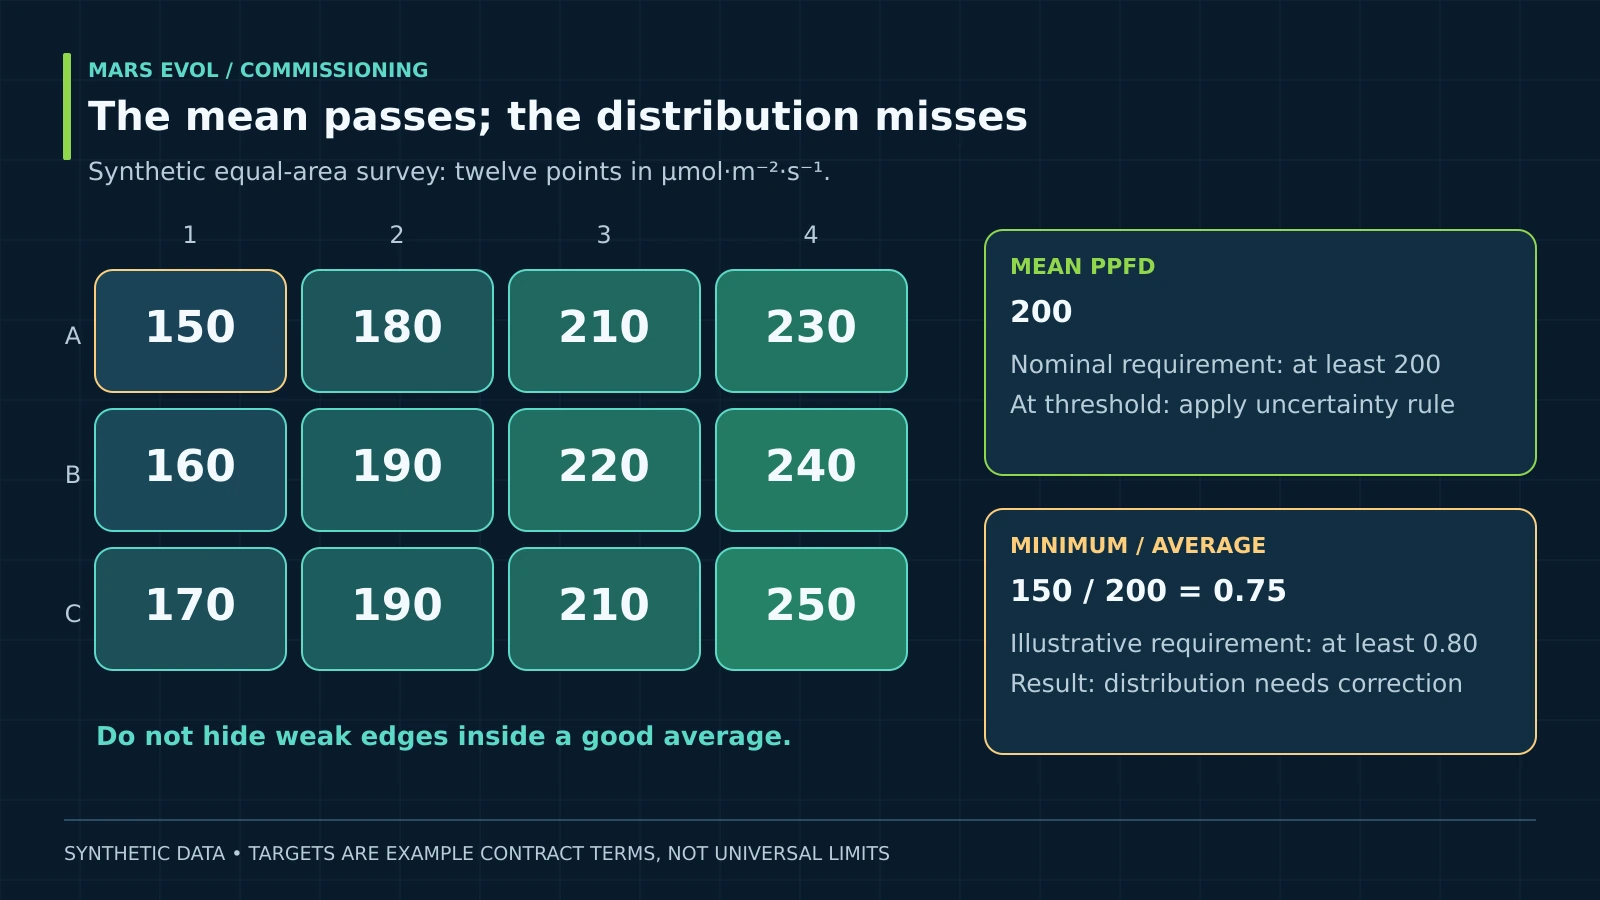
A single average PPFD value can mask unacceptable low-light pockets. Request the minimum, maximum, average, standard deviation where relevant, and a clearly defined uniformity metric such as minimum divided by average over the designated planted polygon. Ask for the raw grid output and point coordinates rather than a raster image only. Also check whether software has omitted perimeter points or walkways in a way that makes the map appear more uniform.
A proposed average of 300 micromoles per square metre per second has a different agronomic meaning when edges routinely receive 160 than when most crop positions fall within a narrow range. The figures here illustrate the reason to inspect distributions; they are not a target for a particular crop. Before comparing bids, normalize the measurement plane, bed geometry, grid density and calculation assumptions across the competing layouts.
Inspect electrical settings and operating cases
Photometric calculations usually represent specific luminaire output settings. Confirm whether the map assumes 100 percent power, a dimmed level, aged output, or an idealized driver. Different settings may alter both output and efficacy. Some zones will operate independently, and adjacent fixtures can influence the map even when they are connected to different circuits. The submission should explain which groups were included in each displayed condition.
Ask for at least a baseline full-output electric-only result and representative planned operating cases. If curtain position, natural sunlight or existing fixtures are included, identify their input values and uncertainty. Do not accept a daytime photograph as proof that a measured electric-light grid is correct. The commissioning plan must recreate a defined state of the system or explicitly subtract ambient contributions using an appropriate measurement method.
Evaluate fixture number against actual crop coverage
The most economical layout is rarely the one with the fewest lights shown on a slide. Fixture quantity, installation cost, power draw, maintenance reach and controllability should be evaluated against delivered photons over the planted region. A sparse array may achieve a nominal central value while leaving crop edges below target, forcing higher operation times or uneven growth. An excessively dense layout may increase capital cost with little agronomic benefit.
Compare bids using the same drawing and measurement boundary. Request input power, fixture PPF, efficiency assumptions, expected PPFD distributions and zone grouping under the same constraints. Keep the design parameters separate from the customer’s biological target: one is a model output and the other is a crop requirement that must be independently justified. An explicit alternative scenario is better than unsupported claims of guaranteed yield improvement.
Build a field measurement grid before ordering
Acceptance is easiest when the proposed measurement grid is part of the purchase specification. Mark coordinates that are accessible and representative of planted canopy, including corners, aisles adjacent to beds and areas with overlapping fixture contributions. Determine how many samples are needed for the footprint and what sensor orientation and height will be used. State whether plant material remains in place during a test and how shadowing by staff or equipment will be avoided.
Use a calibrated PAR quantum sensor with a traceable record, document its response characteristics and follow instrument guidance. Measure at stable driver settings and record the time, sunlight condition, curtain position and greenhouse temperature. If testing during daylight, explain how natural light was handled. Repeatability matters more than a large number of poorly controlled readings. Keep the grid definition identical between the predicted and actual dataset where feasible.
Write realistic supplier acceptance conditions
Purchase documents should specify what must be provided with the offer, before shipment and at site acceptance. The list typically includes the exact fixture photometric source, model and revision, drawings, power schedule, control interfaces, map outputs, measurement method and allowed deviations. If performance depends on a precise suspension height or fixture spacing, make those requirements part of installation instructions. This prevents suppliers from treating the PPFD simulation as an optional illustration.
Acceptance thresholds should be project-specific, measurable and mutually agreed before installation. Avoid universally prescribing a uniformity ratio or crop PPFD without a basis. Determine how results will be reconciled when the as-built geometry differs from the design or one fixture fails to deliver output. Define correction ownership, retest conditions and the documents needed for final signoff. This makes the PPFD map a contract and quality tool rather than only a marketing image.
Turn the map into a lasting operations baseline
Commissioning data can serve as the reference for future crop or equipment changes. Retain original IES files, input drawings, point-based PPFD output, sensor certificate, date of test, selected controller settings and the final fixture schedule. If a greenhouse later switches crop type, adds shade fabric or raises beds, rerun the model and selected field measurements instead of assuming the historic design remains valid.
The most useful report is not necessarily the most colorful. It is the one that another competent engineer can reproduce, challenge and update. A well-defined map connects the biological requirement, fixture specification, physical installation, verified delivery and ongoing maintenance. That transparency reduces procurement risk for growers, integrators and greenhouse builders alike.
Calculation and assumptions
Use average PPFD over the specified canopy plane; this relation does not account for variations in sunlight, output calibration, spectral response, canopy growth or zone overlap. Record all those conditions separately.
Buyer verification checklist
Before approving a quotation, request the site and crop design basis; a scaled drawing with actual planted areas and mounting heights; the exact luminaire data and control protocol; a calculation table with source files; a differentiated analysis of daylight and electric light; the required electrical and structural interfaces; and an acceptance plan with measurable test steps. Record the author, revision date and assumptions of each deliverable so procurement, installation and operations refer to the same approved version.
Ask the supplier to identify unresolved parameters rather than replace unknown information with unmarked defaults. For an early-stage project, separate confirmed requirements from provisional assumptions and describe who must verify each item. A small pilot or bench-level test can be useful, but only if its geometry, light conditions, crop stage and measurement method are sufficiently representative of the larger project.
FAQ
Can I reuse a fixture layout from another greenhouse?
Not without checking dimensions, crop canopy, glazing, suspension, solar climate and intended operating schedule. Reusing a framework is efficient; reusing an unverified map can be expensive.
Is PPFD or DLI more important?
Both are required for many supplemental-lighting decisions. PPFD describes photon rate at the canopy and DLI its integrated daily quantity; distribution and crop response matter too.
Does a higher nameplate output always improve the project?
No. The relevant decision is delivered light over the planted area under real constraints, alongside installation, energy, controls and maintenance costs.
Conclusion
greenhouse PPFD map should produce a documented design decision, not only a product list. Tie the crop goal and calculated light requirement to measured geometry, independent operating constraints, traceable fixture data and a clear acceptance procedure. For a site-specific plan, share bed dimensions, crop stage, location, target DLI or PPFD basis and representative greenhouse photographs through MarsEVOL Solutions. The next useful step is a reviewed engineering layout rather than a generic lighting promise.
Build a Project-Specific Lighting Plan
Send MarsEVOL your greenhouse dimensions, crop plane, proposed fixture layout, mounting heights, PPFD map, calculation assumptions and acceptance criteria. These inputs support a reviewable layout and measurement plan.
Explore More MarsEVOL Resources
Review engineering design inputs and glazing transmission analysis to define crop and natural-light assumptions before requesting a layout.
Use lighting schedule optimization, official lighting resources and electricity tariff analysis to connect control choices with rates, official resources and implementation constraints.
References
- Cornell University. Controlled Environment Agriculture. Institutional resource entry point.
- Michigan State University. Floriculture. Institutional resource entry point.
- U.S. Department of Energy. Solid-State Lighting. Institutional resource entry point.
These are institutional resource entry points, not project-specific endorsements or proof of a particular numerical crop recipe. Verify the latest technical publications and local requirements before design approval.