
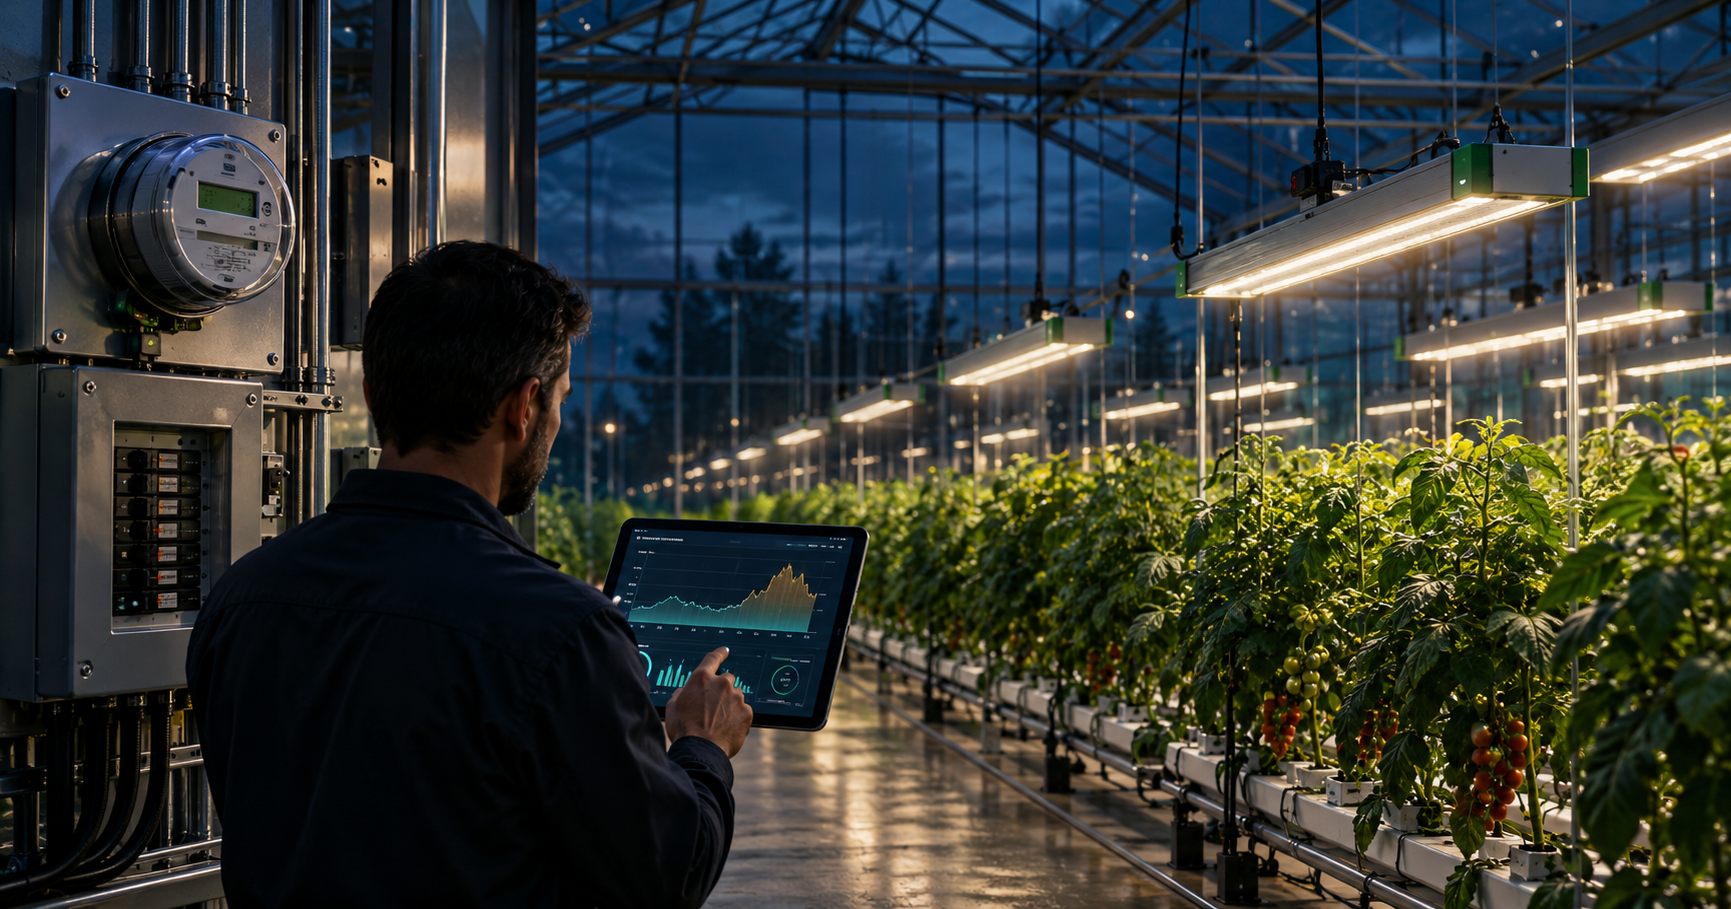
A greenhouse electricity tariff is not just an energy price. The bill may combine energy use, billed demand, time-of-use periods, fixed charges, power-factor provisions and minimums. Start with the exact utility rate schedule and effective date, then compare lighting schedules against whole-site interval demand. A lower-cost hour does not automatically reduce the monthly peak.
For commercial greenhouse lighting, electricity-cost planning should begin with the actual account rather than a regional average. This guide explains how to read greenhouse electricity tariffs, extract the clauses that affect supplemental lighting, and compare operating schedules without double counting charges. If you still need the official sources for your location, start with the Greenhouse Lighting Resources hub.
Verified October 2, 2026: the examples below were checked against current utility and system-operator sources. They illustrate how to read a tariff; they are not universal rates. Always save the exact schedule, revision or effective date that applies to the meter being modeled.
Key Takeaways
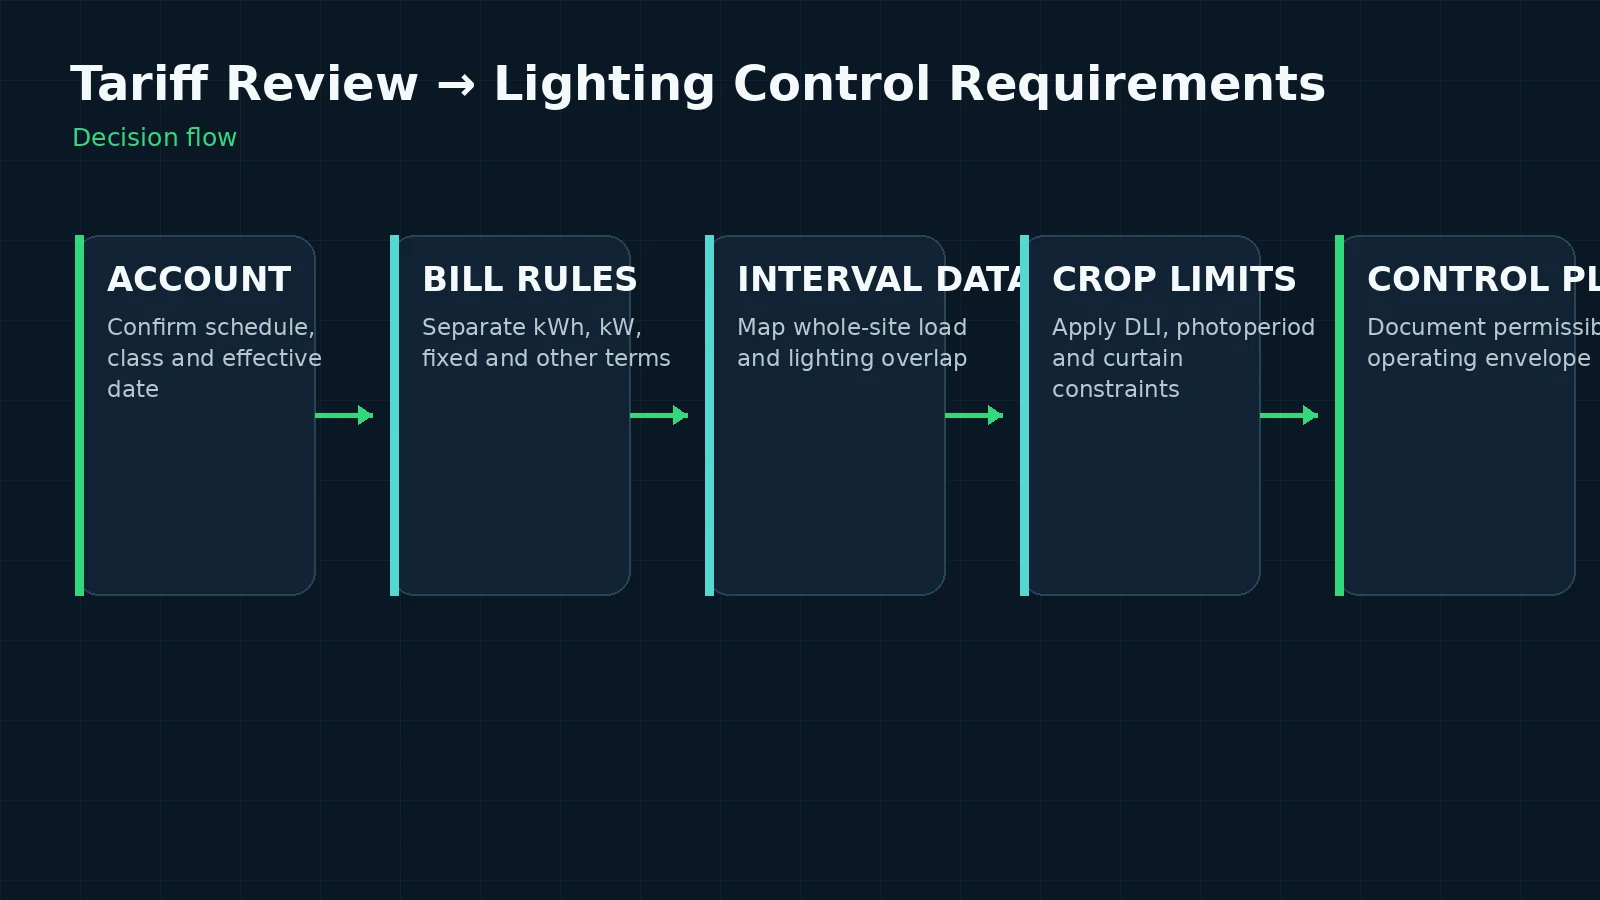
- Match the utility account to its current rate schedule, service class and effective date before modeling lighting cost.
- Separate energy charges from billed-demand, fixed, power-factor and other applicable charges.
- Use whole-site interval data. Lighting nameplate kilowatts are not automatically the billed peak.
- Time shifting can reduce energy cost without reducing demand cost, or reduce both, depending on when the site peak occurs.
- Keep crop DLI, photoperiod, blackout-curtain windows and operating constraints in the control decision.
How do you identify the correct greenhouse electricity tariff?
Start with the most recent utility bill and the utility’s current tariff library. Record the account number internally, service address, rate schedule or rate code, voltage or service class when shown, retail supplier arrangement if applicable, and the tariff effective date. Do not choose a schedule because its name sounds agricultural or because another greenhouse nearby uses it. The account’s actual classification controls the starting point.
PG&E’s current electric-rate page, for example, lists agricultural time-of-use rate sheets effective from March 1, 2026 alongside other commercial and agricultural schedules. That is a reminder to capture the exact schedule rather than use a generic “California TOU” assumption. The applicable sheet may change with service size, voltage, eligibility or other account conditions.
BC Hydro provides a similarly useful classification check. Its current business-rate page distinguishes Small General Service from Medium and Large General Service using demand and annual-energy thresholds. A greenhouse can therefore move into a different cost structure as the facility, service or annual load changes. Confirm the live classification before using an older project spreadsheet.
A practical tariff extraction worksheet should contain these fields:
| Field | What to record | Why it matters |
|---|---|---|
| Schedule / class | Exact utility rate code and revision | Defines the calculation rules |
| Effective date | Date printed on the current tariff | Prevents use of outdated rates or windows |
| Energy charge | Applicable kWh rates by period | Drives variable energy cost |
| Demand rule | kW or kVA basis, interval and minimum | Can make peak timing more important than average load |
| TOU / season | Days, hours, holidays and seasonal dates | Determines when a lighting schedule encounters each price period |
| Other terms | Fixed charges, power factor, riders and taxes as applicable | Completes the auditable bill model |
What parts of the bill should a greenhouse lighting model separate?
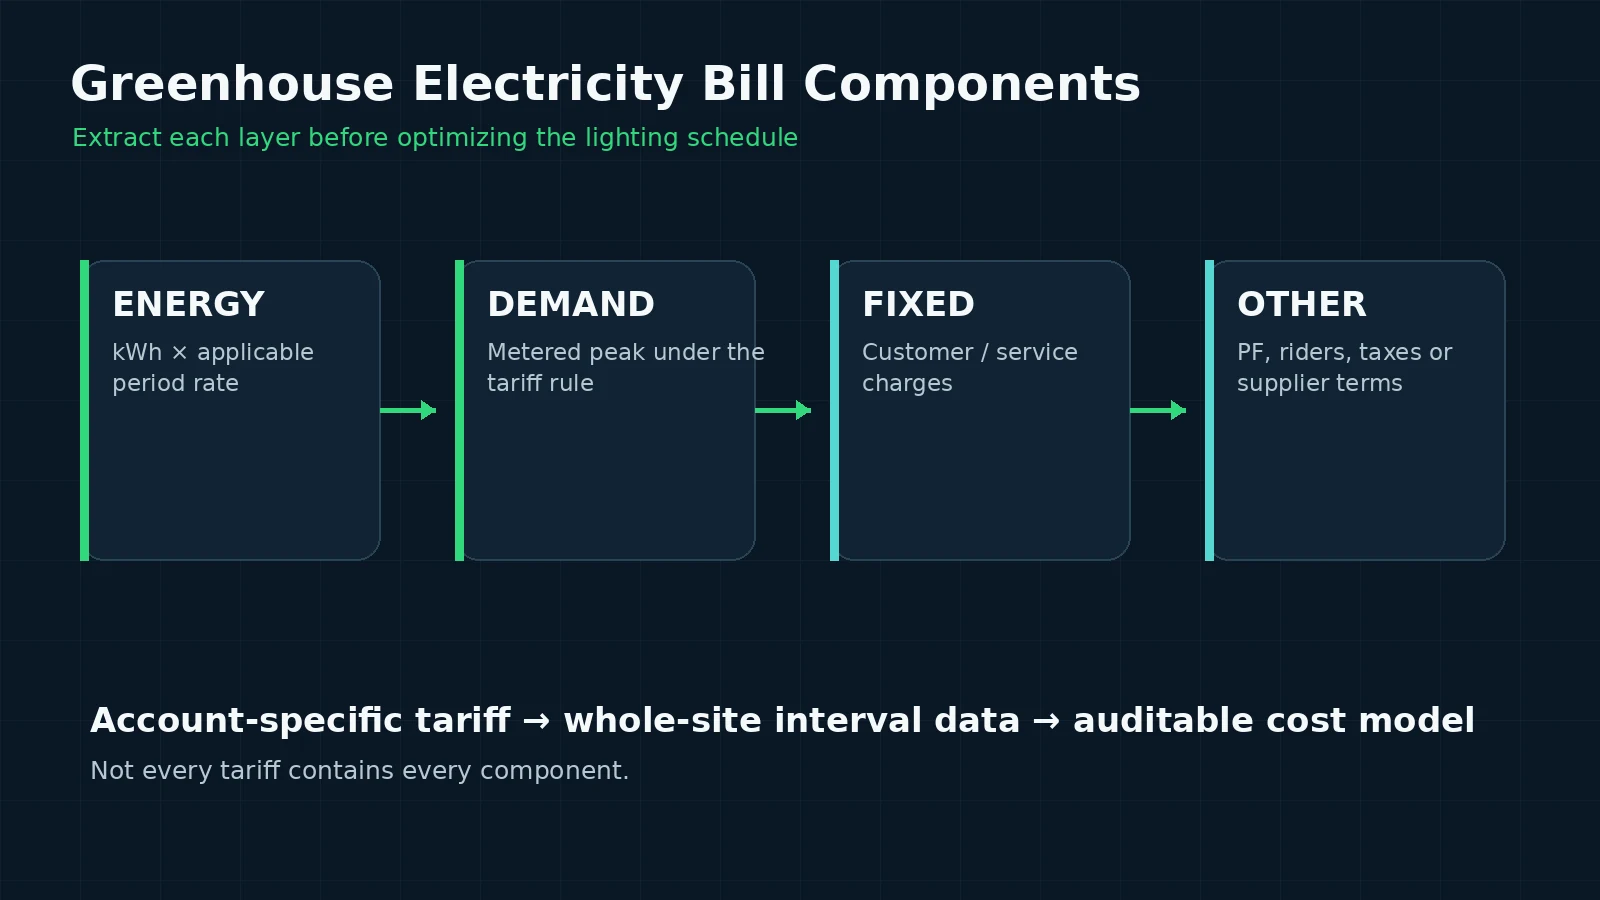
Energy charges are usually tied to kilowatt-hours. Demand charges are tied to a measured or defined peak quantity over an interval or tariff rule. Fixed charges can apply regardless of lighting runtime. Other provisions can include power-factor adjustments, riders, minimum bills, reactive demand, taxes or supplier charges. The exact list comes from the account’s tariff and bill.
BC Hydro’s current Medium General Service page provides a concrete example of why separation matters: it shows an energy charge and a separate demand charge, with demand based on the highest 15-minute average demand during the billing period. It also describes minimum-demand and power-factor provisions. Large General Service uses a different energy/demand structure. These values are jurisdiction-specific examples, not MarsEVOL assumptions for another utility.
For a first-pass annual energy estimate, the basic kilowatt-hours method remains useful. The Greenhouse Lighting Cost Calculator covers that simpler layer. This article adds the tariff logic needed when the real bill depends on when power is used and what the whole facility is doing at the same time.
Why is lighting nameplate power not the same as billed demand?
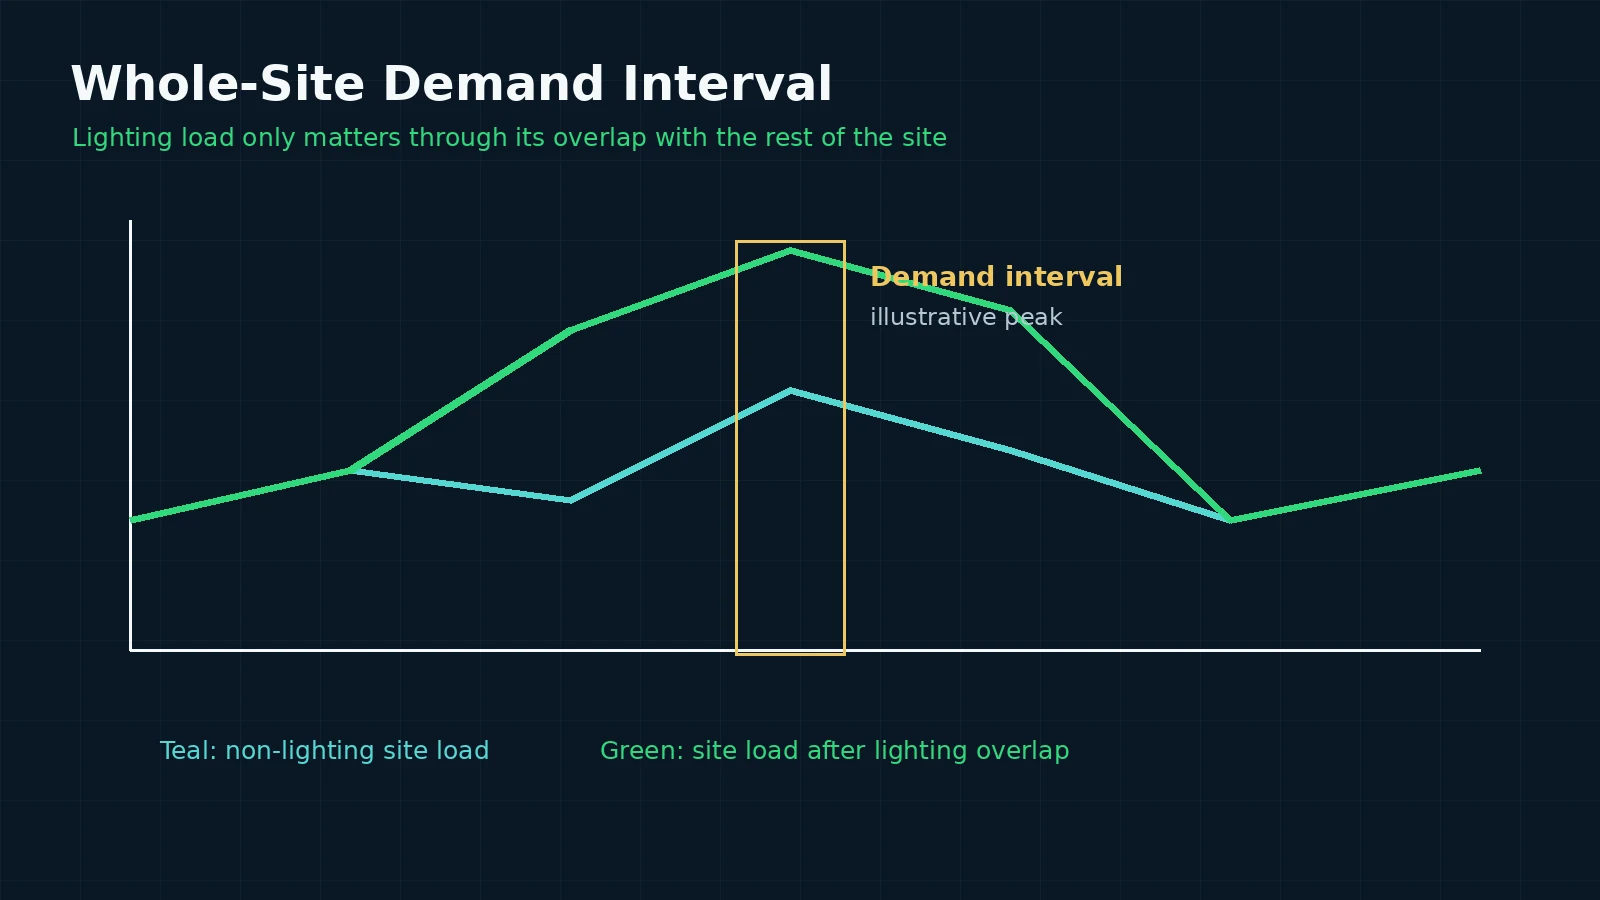
Billed demand is determined by the tariff and the meter. A lighting system may add substantial load, but the monthly billed peak depends on overlap with heating, cooling, pumps, dehumidification, irrigation, packing equipment and other site loads. If those loads peak at different times, simply adding all nameplate ratings can overstate the measured maximum. If they coincide, a lighting schedule can create a new peak.
Use interval data at a resolution compatible with the billing method. If the utility uses a 15-minute demand interval, a monthly energy total cannot reveal whether lighting created a short peak. Obtain interval data from the utility portal, meter export or energy-management system, then align it with actual lighting operation.
Demand minimums and ratchets also matter where they are written into the tariff. A project can reduce the current measured peak yet still see a higher billed demand because the billing rule references a minimum or a prior peak. Do not assume every demand tariff has a ratchet; extract the actual clause.
How should TOU and seasonal windows affect a lighting schedule?
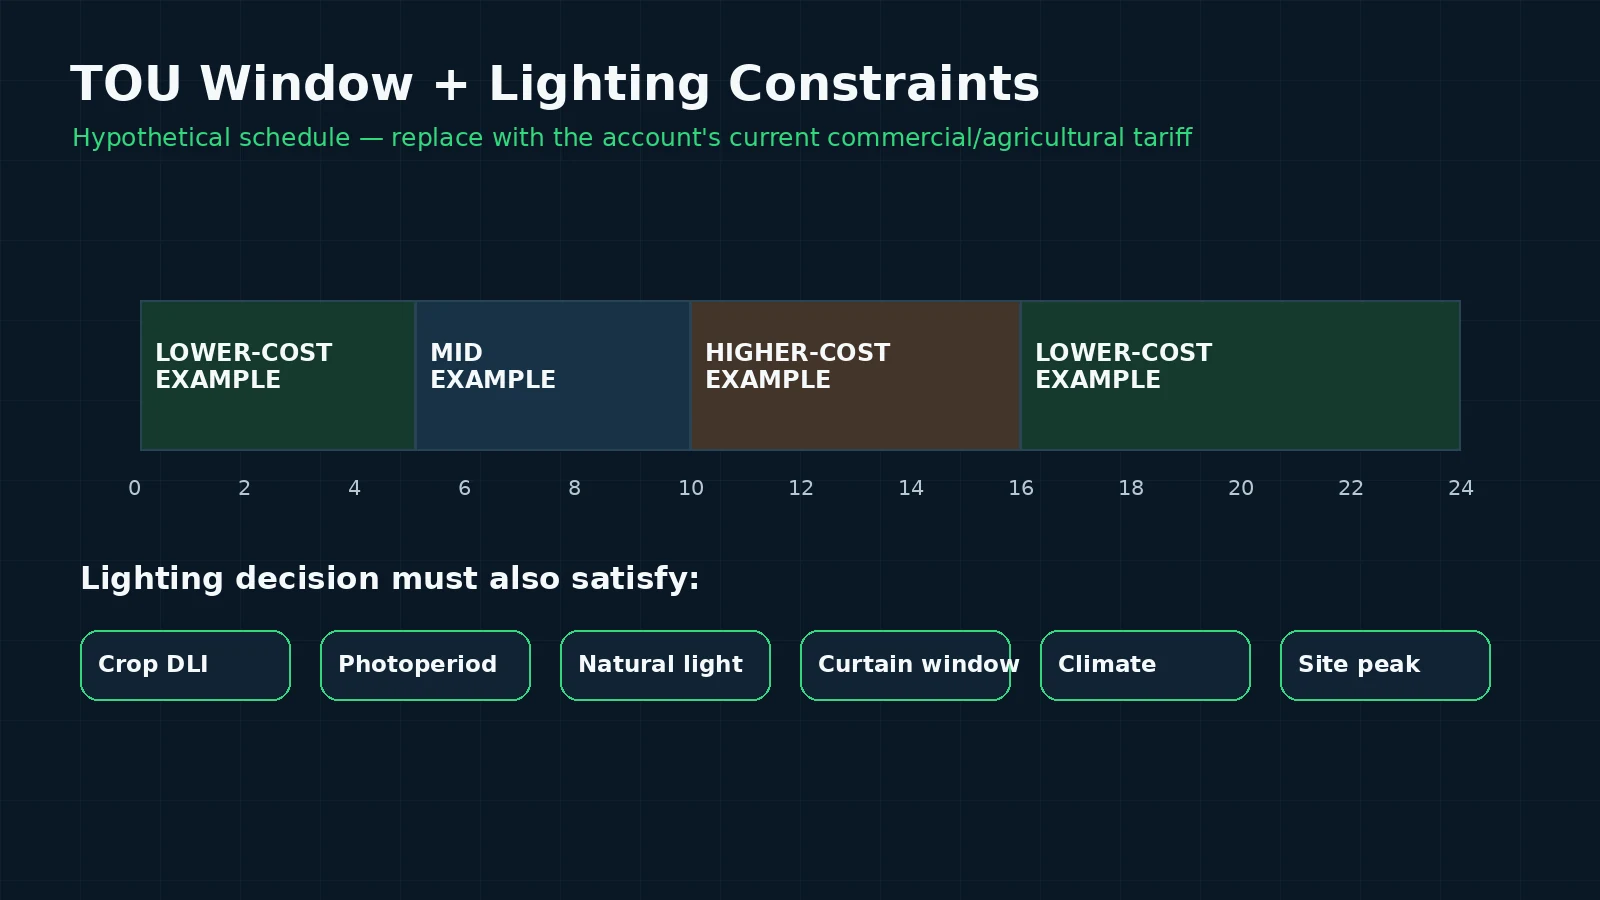
Time-of-use pricing assigns different energy prices to defined periods. Read the tariff for weekdays, weekends, holidays, seasonal dates and any special agricultural provisions. Never borrow residential TOU windows for a commercial greenhouse account. PG&E’s current rate library is a good example: multiple agricultural schedules coexist, so the exact current sheet must be attached to the project model.
A lower energy-price period is attractive only if crop and site constraints permit operation then. Supplemental lighting is part of a biological schedule: target DLI, photoperiod, natural-light availability, dark-period requirements and crop strategy still matter. The DLI Lighting Control guide explains how accumulated natural light changes the supplemental-lighting need through the day.
Light-abatement windows can add another constraint. Where a local rule requires curtains or limits visible emissions, a cheap tariff period may coincide with a less desirable climate-control state. The tariff optimization should therefore be evaluated together with curtain and greenhouse-control requirements rather than as an isolated electricity problem.
How do you compare two greenhouse lighting schedules without misleading the buyer?
Use equal crop-light assumptions first. Suppose an illustrative facility has 90 kW of non-lighting load during one candidate lighting window and 45 kW during another. The proposed lighting load is 120 kW in both cases. In the first window the coincident site load reaches 210 kW; in the second it reaches 165 kW. The lighting energy can be the same while the site peak differs by 45 kW.
That difference does not automatically equal a bill saving. The utility may calculate billed demand differently, apply a minimum, use a different interval, or charge demand only in certain periods. The correct next step is to apply the actual tariff rules to both whole-site profiles. Keep the calculation transparent so a grower can trace every input back to the bill, interval export, fixture schedule or tariff page.
Ontario customers need another classification check. The Independent Electricity System Operator explains that Class A Global Adjustment treatment under the Industrial Conservation Initiative is linked to a customer’s contribution to Ontario’s top five system peak hours, while Class B allocation follows a different consumption-based approach. A greenhouse model should therefore establish the customer’s class and bill treatment before adding any Global Adjustment assumption. For Regulated Price Plan customers, Global Adjustment is already included in regulated pricing and should not be added again.
Government statistical averages are useful for market context but not for project billing. The U.S. Energy Information Administration publishes current electricity data and average prices; those series can help compare regions or trends, but they do not replace the utility’s retail tariff for a specific greenhouse.
How do you turn tariff analysis into greenhouse control requirements?
Once the tariff model is verified, convert it into constraints rather than a single “cheapest-hour” instruction. A control plan can use natural-light response, DLI progress, maximum allowable site demand, available lighting zones and local curtain requirements together. The Greenhouse Lighting Control System guide covers zoning and control architecture; the Electrical Design guide covers load and distribution information that should be coordinated with the qualified electrical designer.
A practical requirements sheet can include:
- the current tariff schedule and next review date;
- the demand threshold or peak-management objective, if applicable;
- the crop DLI and photoperiod boundaries;
- lighting-zone priorities when full output is not required everywhere;
- curtain or local light-abatement constraints;
- manual override, alarm and operator-review rules;
- the interval data that will be retained to verify performance.
Do not let tariff logic override crop protection, safety or required environmental control. A useful system proposes a permissible operating envelope; it does not blindly suppress lighting because electricity is expensive.
Common tariff-analysis mistakes in greenhouse lighting projects
- Using a state or provincial average as the project rate: averages are context, not the account’s tariff.
- Multiplying fixture kW by a demand rate: billed demand is based on the tariff-defined site measurement, not automatically the lighting nameplate.
- Ignoring the effective date: utilities revise prices, periods and eligibility.
- Using residential TOU windows: commercial and agricultural schedules can differ materially.
- Shifting lighting without crop constraints: the lowest price period may conflict with DLI, photoperiod or climate strategy.
- Double counting a market or system charge: first confirm whether it is already embedded in the customer’s retail price.
- Comparing schedules with different crop-light delivery: cost comparisons should hold the agronomic objective constant unless the change is intentional and documented.
FAQs About Greenhouse Electricity Tariffs
Is the lowest kWh rate always the best time to run grow lights?
No. Demand charges, crop DLI, photoperiod, other site loads and local curtain constraints can change the answer. Compare whole-site schedules under the actual tariff.
Can I estimate demand cost from the fixture quotation?
Not reliably. The quotation gives lighting load, while billed demand depends on the metered site peak and tariff rule. Use interval data and the applicable billing method.
Should I use EIA or provincial average electricity prices in an ROI model?
Use them only for market context or early screening. A decision-grade project model should use the customer’s current retail tariff and any applicable supplier charges.
How often should the tariff assumptions be checked?
At minimum, recheck before a major commercial commitment and whenever the utility posts a new effective schedule. Long projects should also record a tariff-review date in the design basis.
Can smart controls reduce the demand peak?
They can support a peak-management strategy when sufficient lighting-zone flexibility exists, but the result depends on site loads, crop constraints and the tariff. Verify with interval data rather than assuming a reduction.
Does shifting lighting reduce total kWh?
Not necessarily. Moving the same lighting runtime changes timing, not energy quantity. Energy savings require a change in delivered lighting, fixture efficiency, dimming response or another documented operating condition.
The MarsEVOL Perspective
A good greenhouse lighting proposal should make its electricity assumptions auditable. MarsEVOL recommends recording the exact tariff, the whole-site interval baseline, the crop-light requirement and the proposed control logic in the same design package. For fixture selection, compare system-level assumptions rather than a single watts-per-fixture number. The Commercial Greenhouse LED Proposal guide provides a broader technical-commercial checklist, while LED vs HPS Greenhouse Lighting explains the retrofit comparison context.
Conclusion
Greenhouse electricity tariffs should be modeled as a set of billing rules, not one cents-per-kWh input. Identify the correct schedule, separate energy and demand, use whole-site interval data, and test lighting schedules under the same crop-light objective. The resulting model is easier to audit, easier to update when tariffs change and far more useful for control design.
Request a Free Lighting Plan
Share your greenhouse location, utility/rate schedule, crop, operating months, available interval data and lighting goals. MarsEVOL can help structure a lighting plan around DLI, layout, controls and the real operating constraints of your site.
Explore More MarsEVOL Resources
Start from official sources for incentives, tariffs and local project requirements.
Build the basic energy-use layer before adding tariff-specific demand and TOU logic.
References
Official sources checked October 2, 2026. Reconfirm the account-specific tariff before making a commercial or operating decision.
- Pacific Gas and Electric Company. Electric Rates. Current tariff library, including agricultural time-of-use rate sheets effective March 1, 2026.
- BC Hydro. General Service Business Rates. Current Small, Medium and Large General Service classifications and billing components.
- Independent Electricity System Operator. Global Adjustment. Ontario allocation overview for Class A and Class B consumers.
- Independent Electricity System Operator. Global Adjustment for Class A. Industrial Conservation Initiative and peak-demand-factor guidance.
- U.S. Energy Information Administration. Electricity Data. Statistical electricity-price and sales data for market context, not account billing.