
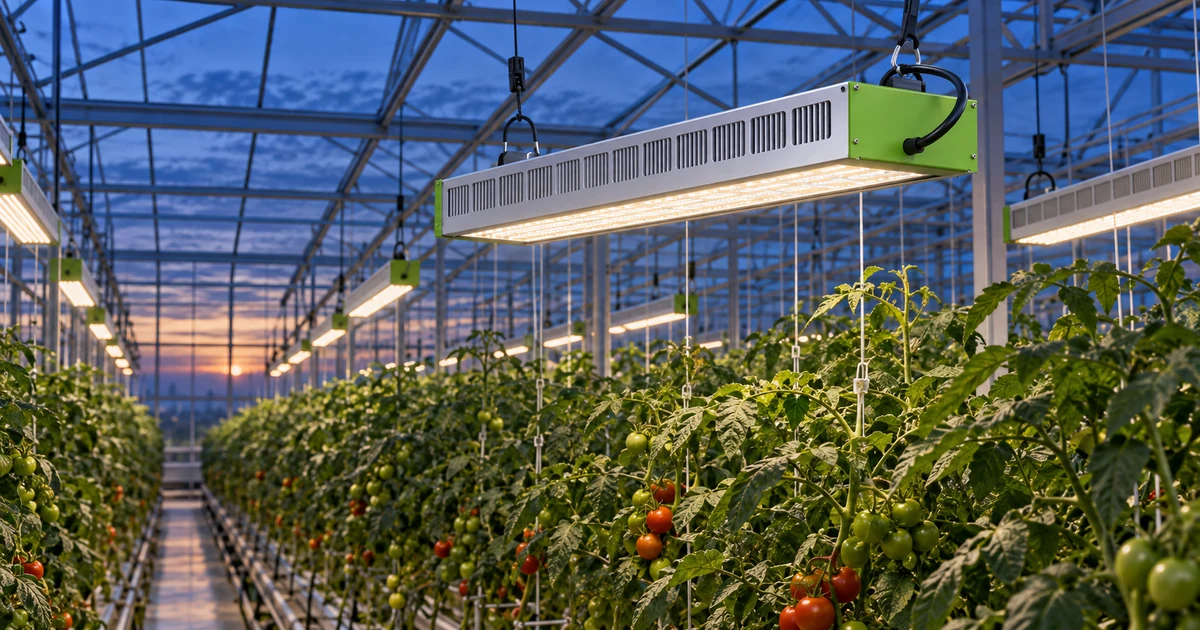
A greenhouse lighting cost calculator should multiply actual AC input power at each operating state by the hours in that state, then apply the facility’s current energy, demand and fixed charges. Use interval schedules and the utility tariff—not fixture wattage multiplied by a national average price. Keep every rate, dimming value and billing-demand rule visible so the estimate can be audited.
System context: For the complete design framework—from crop DLI and sunlight deficit through PPFD, runtime, layout, controls and commercial evaluation—use the greenhouse supplemental lighting guide.
Key Takeaways
- Calculate kWh from real input power at full, dimmed, standby and off states—not control percentage alone.
- Apply time-of-use energy rates to the intervals in which the lighting actually operates.
- Model billing demand separately; kWh and kW are different charge bases.
- Use the current tariff and recent invoices. Published average electricity prices are not project rates.
- Keep a screening estimate, an operating budget and an invoice-validation model as three different levels of evidence.
The cost of greenhouse lighting is not one number printed on a luminaire data sheet. It is the electrical load created by the selected fixture quantity and operating states, combined with the facility’s tariff and the timing of the rest of the site load. The method below estimates the lighting portion of an electricity bill. It does not predict crop revenue, HVAC effects, financing or project payback.
Start by defining lighting hours from the crop plan. The MarsEVOL guide to supplemental lighting runtime covers the DLI-to-hours question. Then confirm the exact electrical inputs and system boundary using the greenhouse lighting electrical design checklist. This article begins after those technical decisions are documented.
What Inputs Does a Greenhouse Lighting Cost Calculator Need?
A decision-grade calculator needs seven inputs: fixture quantity, input power by state, operating intervals, billing days, energy rates, billing-demand rules and other bill charges. Each input should carry a source and date.
| Input | Preferred evidence | Why it matters |
|---|---|---|
| 1. Fixture quantity | Approved layout and model schedule | Converts per-fixture power into system load |
| 2. AC input power by state | Model-specific test report, specification or measured watts | Captures full, intermediate, minimum and standby consumption |
| 3. Operating intervals | Controller export or time-stamped schedule | Assigns each power state to actual hours |
| 4. Billing days | Utility billing period | A calendar month is not always exactly 30 days |
| 5. Energy rates | Current tariff and invoice line items | Separates on-peak, off-peak, seasonal and tiered kWh charges |
| 6. Billing-demand rule | Tariff definition and interval meter data | Determines which measured kW value is billed |
| 7. Other charges | Recent invoices and tariff riders | Adds fixed, meter, rider and tax treatment where applicable |
The U.S. Energy Information Administration states that it does not publish customer tariffs or demand-charge data and directs users to individual utilities or the DOE-sponsored Utility Rate Database. [1] The database can help locate a rate structure, but the serving utility’s current tariff remains the controlling source. [7] EIA’s average prices are useful context, but locality, customer class and season can change the result materially. [2]
How Do You Calculate Greenhouse Lighting kWh?
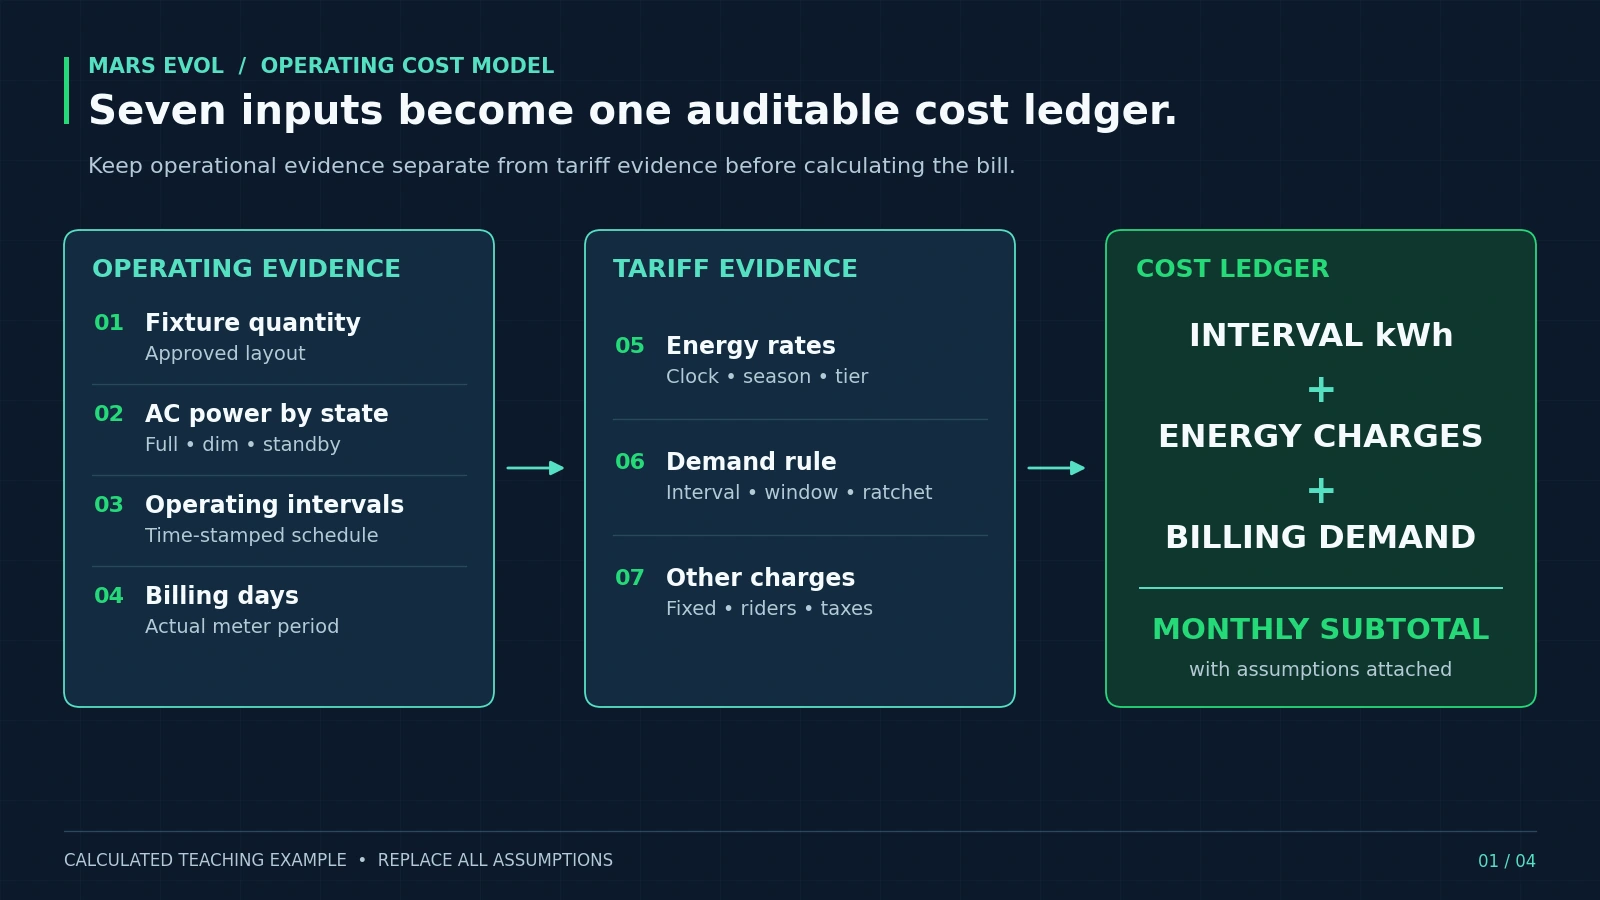
Calculate connected load first, then sum the energy used in every operating interval. Connected load is a capacity value in kilowatts. Energy is that load integrated over time in kilowatt-hours.
Do not assume a 50% light-output command consumes exactly 50% of full input power. Driver losses, minimum output and standby behavior can make the relationship nonlinear. DLC Horticultural Lighting V4.0 requires listed dimmable products to report minimum input wattage and to include standby power in that value when the control signal can turn the product off. [4] For intermediate states, use a manufacturer curve or field measurement at the intended voltage and temperature.
If a zone has a different fixture count or operating state, calculate it as a separate series. The greenhouse lighting control system guide explains why crop zones and power circuits are related but not interchangeable.
How Do You Convert Lighting kWh into a Utility-Bill Estimate?
Assign each kWh interval to its tariff period, then add any attributable billing-demand, fixed, rider and tax charges. A single blended cents-per-kWh value is acceptable only for an early screen.
Energy Charges
Energy charges pay for kilowatt-hours. Map controller or meter intervals to the tariff clock, weekday, holiday, season and tier. Include separate delivery or adjustment rates when the invoice applies them per kWh.
Demand Charges
Demand charges pay for a defined peak kilowatt value, not total energy. The billed value may use the highest 15-minute or 30-minute interval, a time-window peak, a seasonal ratchet, a contract minimum or another rule. The tariff controls. If lighting turns on while heating, cooling and pumps are already near the facility peak, its incremental demand cost can differ from fixture connected load.
For an incremental model, compare the whole-site billing-demand calculation with and without lighting. Do not automatically assign the facility’s entire demand charge to the lights. Conversely, do not omit demand merely because lighting runs for fewer hours.
Fixed Charges, Riders and Taxes
Only allocate charges that the lighting project actually changes or that the budget intentionally assigns. A service fee may be unchanged by lighting; a kWh rider may scale directly; a new service class may change several lines. Keep the source invoice beside the model. ENERGY STAR recommends benchmarking with utility bills so energy information becomes a trackable operating baseline. [3]
Worked Example: What Would 100 Fixtures Cost per Month?
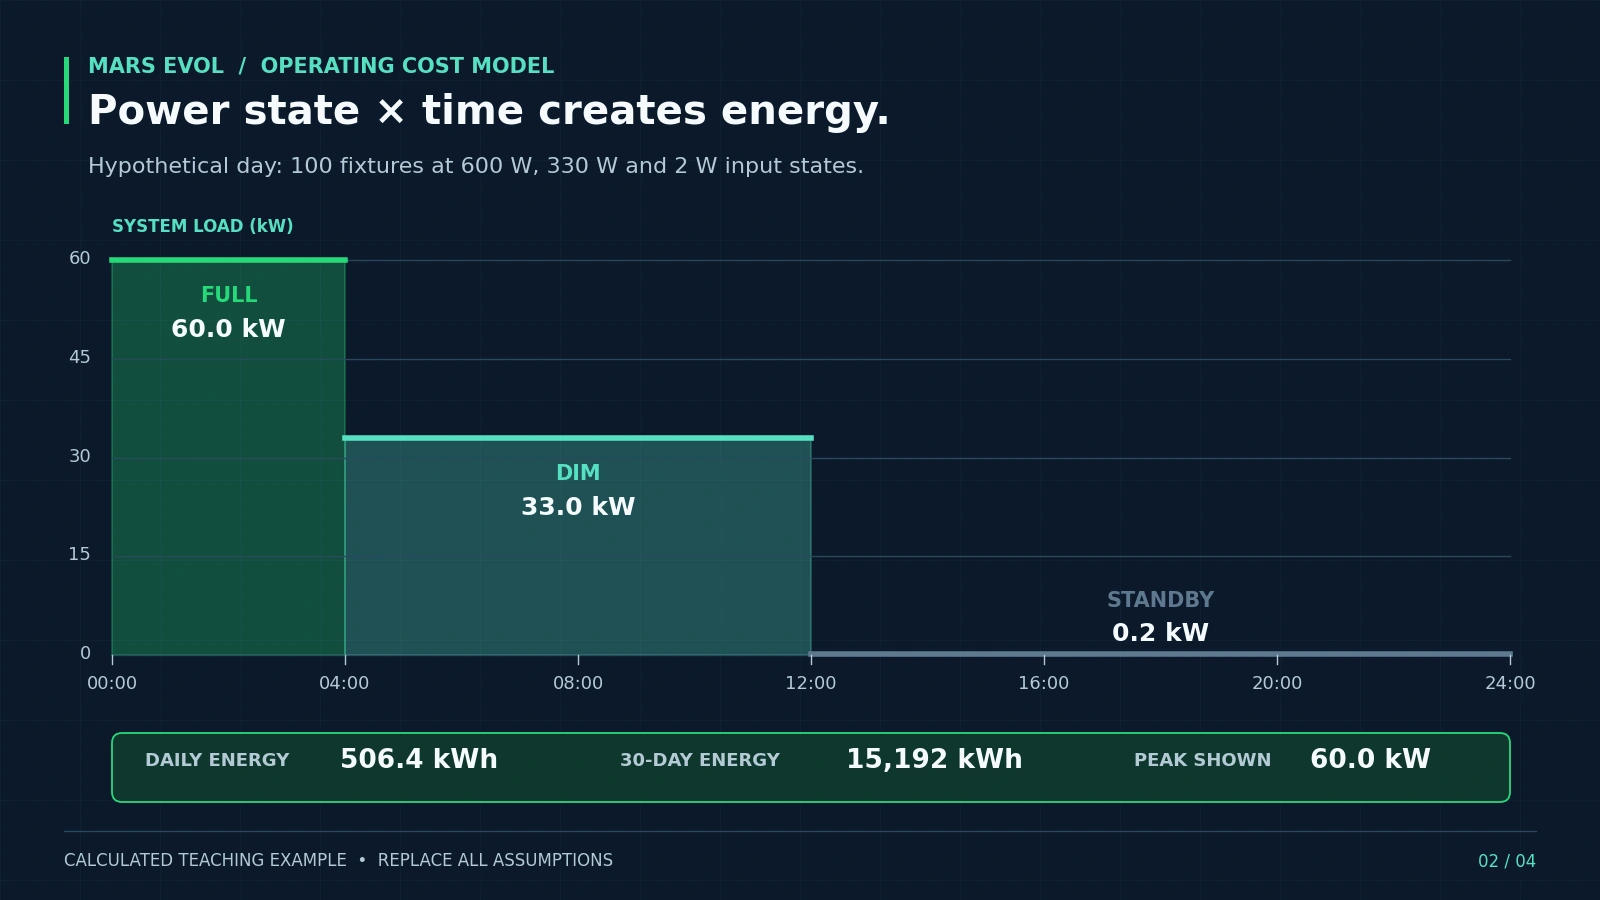
Under the hypothetical assumptions below, 100 fixtures use 15,192 kWh and produce a $2,617.80 monthly lighting-only subtotal. These are teaching values—not MarsEVOL product data, a utility quote or a promised operating cost.
| Illustrative input | Assumption | Source status |
|---|---|---|
| Fixture quantity | 100 | Hypothetical |
| Full-output input | 0.600 kW each for 4 h/day | Hypothetical measured state |
| Dim-state input | 0.330 kW each for 8 h/day | Hypothetical measured state; not derived from command percentage |
| Standby input | 0.002 kW each for 12 h/day | Hypothetical |
| Billing period | 30 days | Hypothetical |
| Energy split | 9,600 kWh off-peak; 5,592 kWh on-peak | Calculated interval allocation |
| Energy rates | $0.09/kWh off-peak; $0.15/kWh on-peak | Hypothetical |
| Billing demand | 60 kW at $14/kW | Hypothetical tariff result |
| Fixed charge | $75 | Hypothetical |
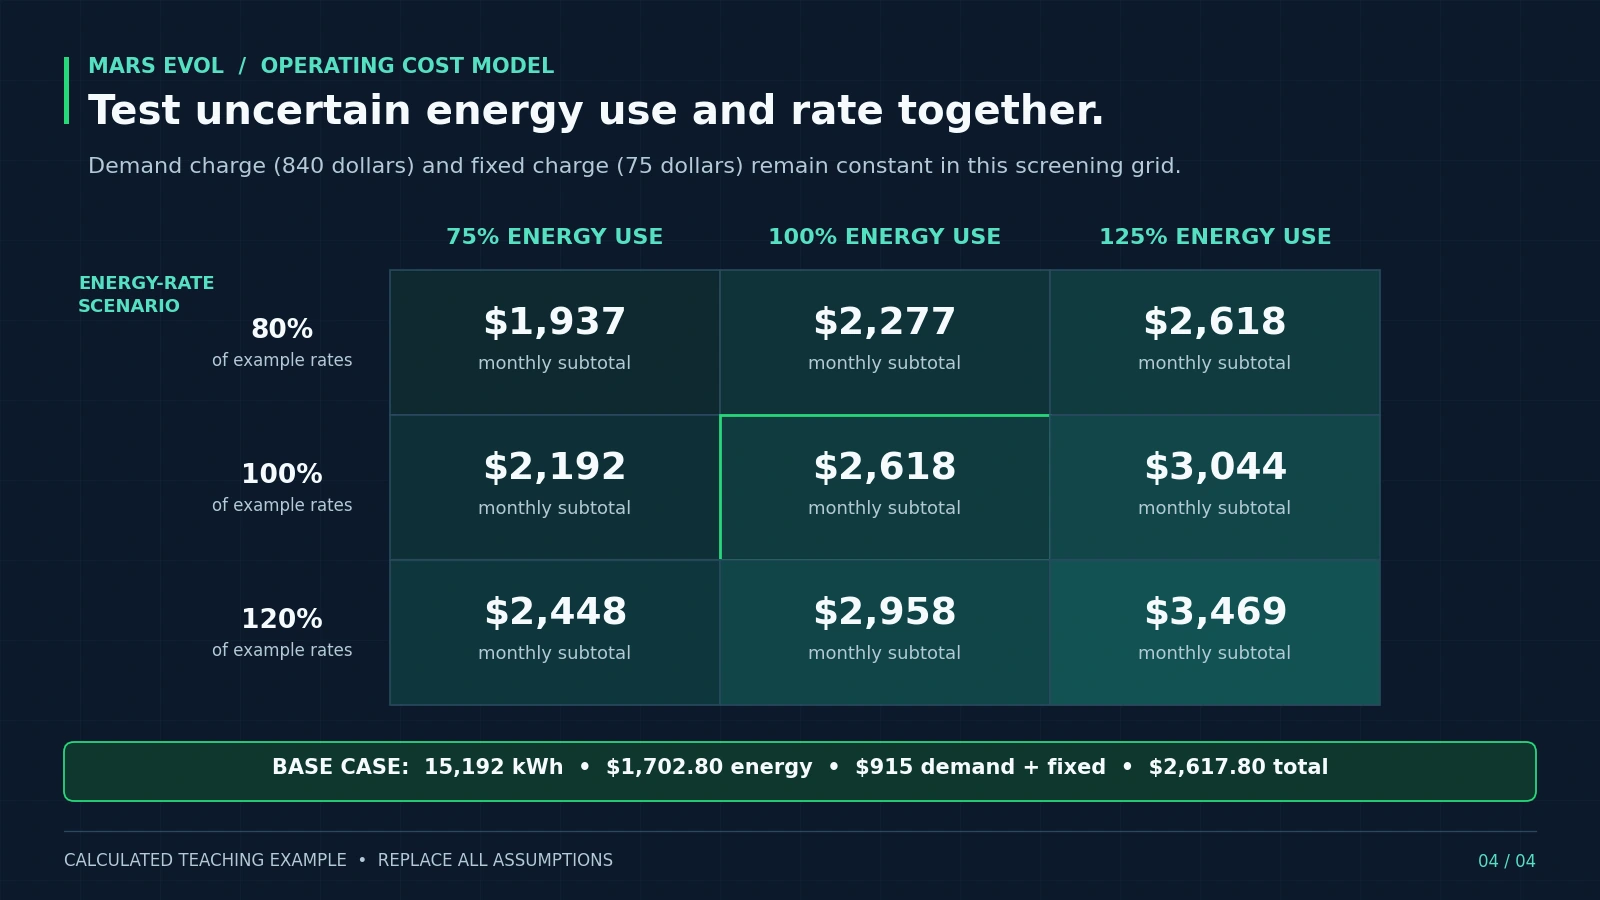
The full-output block uses 7,200 kWh; the dimmed block uses 7,920 kWh; and standby uses 72 kWh. Energy charges are $864.00 off-peak plus $838.80 on-peak. The demand charge is $840.00 and the fixed charge is $75.00, giving a subtotal of $2,617.80. The constructed effective cost is about $0.172/kWh after demand and the fixed charge.
That effective rate should not be copied to another project. It also should not be treated as incremental cost if the facility would pay the same fixed fee without lighting or if another load already establishes the same billing peak. Taxes, riders, controller power and other facility loads are excluded.
How Should the Calculator Handle Dimming, Weather and Zones?
Build the load profile from intervals or representative operating states, not one average dimming percentage. At minimum, keep separate profiles for dark winter, typical shoulder-season and bright-day operation.
Daylight-responsive control can reduce supplemental-light hours or input power while maintaining a defined light objective. Van Iersel and Gianino tested adaptive LED duty-cycle control based on ambient photosynthetic photon flux. [5] Jayalath, van Iersel and Ferrarezi later evaluated a flexible multi-day DLI strategy. [6] Rea, Brons and Jarboe used daylight-and-electric-light simulations to examine energy-reduction strategies in controlled agriculture. [8] These studies support measuring control behavior; they do not supply a universal savings percentage for a commercial project.
For each zone, export time-stamped command state and, preferably, AC power. Reconcile that record with the DLI lighting control objective. If the HarveStation system or another controller groups crops by zone, document the fixture count attached to each state. Do not assume controller output percentage is the same as input-power percentage.
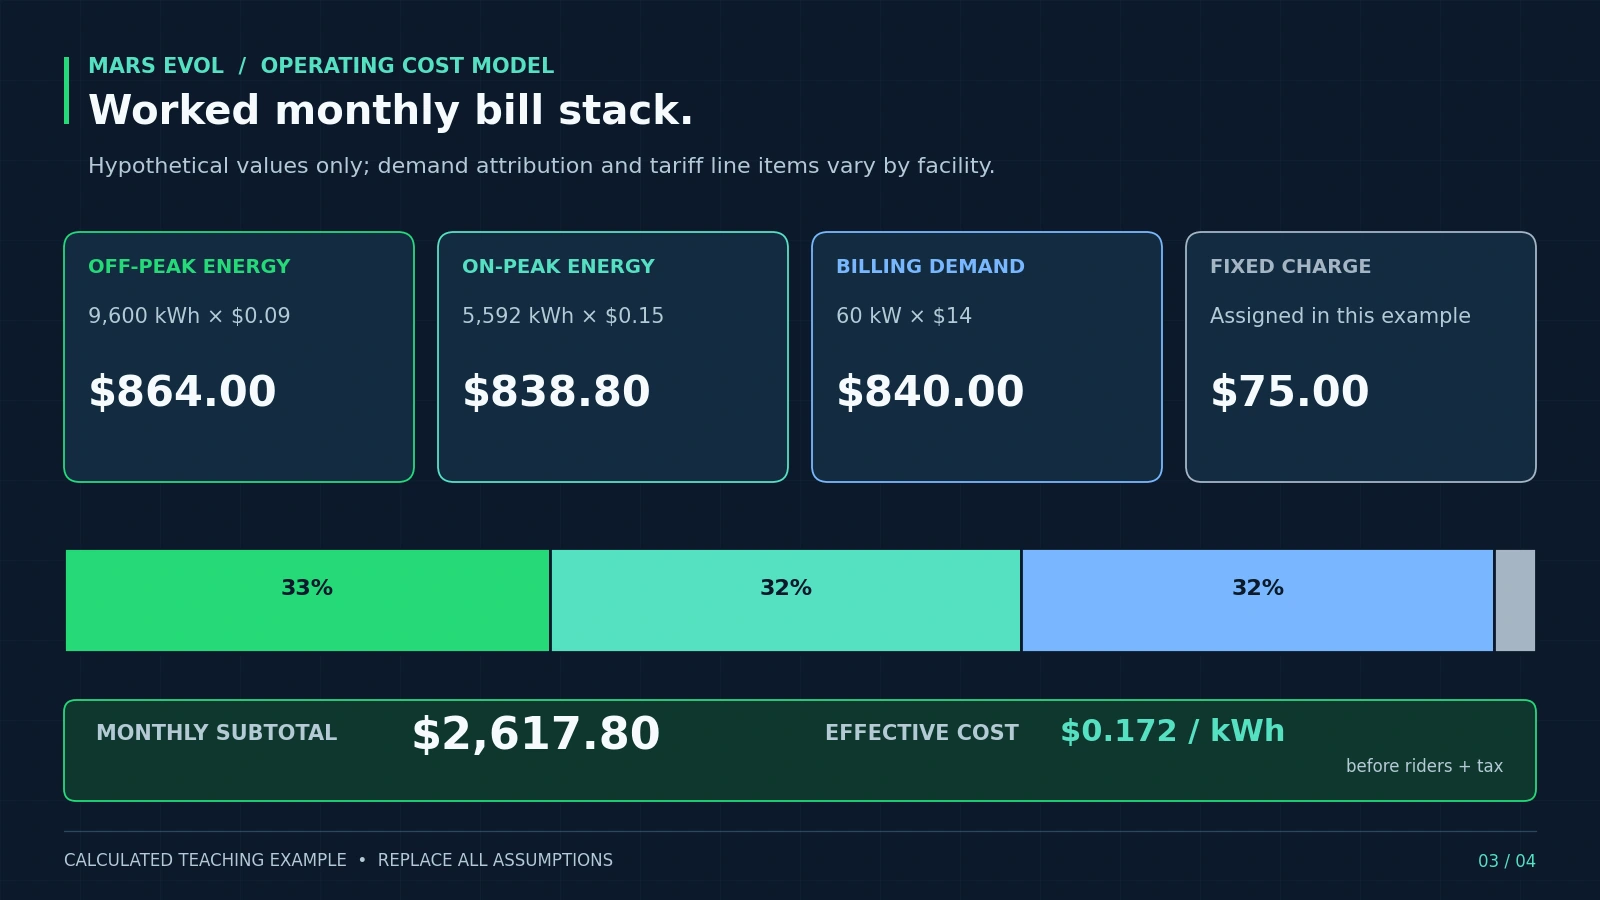
Use a sensitivity grid for uncertain inputs. The figure below holds the illustrative $840 demand charge and $75 fixed charge constant while varying the example’s energy use and energy-rate component. It is a screening boundary, not a tariff simulation.
Which Cost Model Should a Greenhouse Project Use?
Use the least complex model that can answer the decision, then upgrade the evidence before purchase or verification.
| Model level | Minimum inputs | Appropriate decision | Main limitation |
|---|---|---|---|
| Screening estimate | Fixture count, full input watts, equivalent full-power hours, simple rate | Compare rough operating scale | Misses tariff timing and peak interaction |
| Operating budget | Power by state, zone schedules, seasonal scenarios, current tariff, demand rules | Budget and proposal evaluation | Still depends on predicted weather and controls |
| Invoice validation | Interval lighting power, whole-site interval data, actual invoices and tariff | Verify cost after commissioning | Requires clean metering boundaries and data alignment |
A technology comparison or investment decision needs more than this bill model. The LED versus HPS greenhouse guide adds equal-photon design, greenhouse heat, maintenance and financial analysis. Do not mix a lighting-electricity estimate with a full ROI claim.
Common Greenhouse Lighting Cost Calculation Mistakes
- Multiplying nameplate watts by scheduled hours: replace the shortcut with power by operating state when dimming is material.
- Treating output percentage as power percentage: use the selected driver’s evidence or measured watts.
- Using an average electricity price as a tariff: retrieve the current customer-class tariff and recent invoices.
- Adding the full connected load as demand cost: run the tariff’s billing-demand rule on the whole-site interval profile.
- Omitting standby: include energized off-state power where it exists.
- Using a 30-day month for an annual forecast: use the actual billing calendar, crop seasons and daylight scenarios.
- Calling avoided kWh “savings” before verification: preserve the baseline, commissioning data and production boundary.
FAQ: Greenhouse Lighting Cost Calculator
Can I calculate cost from fixture wattage alone?
Only for a rough full-power screen. A budget should include power at every operating state, actual hours, the tariff’s energy periods and any attributable demand charge.
Does 50% dimming use 50% electricity?
Not necessarily. The command-to-light and light-to-input-power relationships depend on the driver and luminaire. Use a verified curve or measure the selected fixture state.
What is the difference between kW and kWh?
kW is instantaneous real-power demand. kWh is energy accumulated over time. Utilities may bill each under different rules.
Should I use the utility’s average cents per kWh?
Use it only for an early screen. A decision model should reproduce applicable energy periods, delivery charges, demand rules, fixed charges, riders and taxes from the current tariff and invoices.
Can daylight control lower demand charges?
It can if it reduces lighting during the interval that establishes billing demand. Savings are not automatic; compare synchronized whole-site profiles under the tariff’s exact rule.
Does this calculator include greenhouse heating and cooling?
No. It estimates lighting electricity. Add heating, cooling, maintenance, capital, incentives and production effects in a separate whole-project cash-flow model.
MarsEVOL Perspective: Make Cost an Auditable Operating Model
MarsEVOL recommends linking four records: the approved lighting layout, exact fixture configuration, zone operating schedule and utility tariff. The SOLIFY product family can be considered for greenhouse projects, but the cost model must use the input-power documentation for the exact supplied configuration rather than a family-level assumption.
At commissioning, record fixture state, real input power and time for representative zones. After operation begins, compare modeled kWh with meter or submeter data and reconcile exceptions. This turns the greenhouse lighting cost calculator from a sales estimate into a maintained operating baseline.
Conclusion
A reliable greenhouse lighting electricity estimate is a transparent load profile connected to a real tariff. Count the exact fixtures, use AC input power at every operating state, align those states with the billing calendar, calculate energy and demand separately, and preserve all assumptions. Then update the model with commissioning and invoice data instead of treating the first estimate as permanent truth.
Need a Project-Specific Lighting Cost Estimate?
Send your greenhouse drawing, crop-light objective, proposed fixture schedule, supply details, operating windows and a redacted utility tariff or invoice. MarsEVOL can help organize the lighting load and control assumptions for review; the utility and project professionals remain responsible for tariff interpretation and final financial approval.
Explore More MarsEVOL Resources
Collect the crop, layout, electrical, control, cost and acceptance evidence before comparing quotations.
Connect fixture selection, layout support and dimming strategy to a defined greenhouse project.
References
Technical sources checked September 17, 2026. Tariffs and product documentation can change; confirm current project-specific versions.
- U.S. Energy Information Administration. Does EIA publish electric utility rate, tariff, and demand-charge data? Official FAQ, accessed 2026.
- U.S. Energy Information Administration. Electricity explained: Prices and factors affecting prices. Official statistics and explanatory documentation, 2026.
- U.S. Environmental Protection Agency, ENERGY STAR. Benchmark Your Building With Portfolio Manager. Official benchmarking guidance, accessed 2026.
- DesignLights Consortium. Technical Requirements for LED-Based Horticultural Lighting V4.0. Released March 12, 2025; revised October 1, 2025.
- van Iersel, M. W., and Gianino, D. An Adaptive Control Approach for Light-Emitting Diode Lights Can Reduce the Energy Costs of Supplemental Lighting in Greenhouses. HortScience 52(1):72–77, 2017. DOI: 10.21273/HORTSCI11385-16.
- Jayalath, T. C., van Iersel, M. W., and Ferrarezi, R. S. The Energy Requirement for Supplemental Greenhouse Lighting Can Be Reduced by Considering ‘Excess’ Light from the Previous Day. Plants 13(5):652, 2024. DOI: 10.3390/plants13050652.
- U.S. Department of Energy Open Energy Information. Utility Rate Database. DOE-sponsored rate-structure resource; confirm entries against the serving utility.
- Rea, M. S., Brons, J., and Jarboe, C. Reducing Lighting Energy Use in Controlled Agricultural Environments. HortScience 58(8):954–961, 2023. DOI: 10.21273/HORTSCI17193-23.